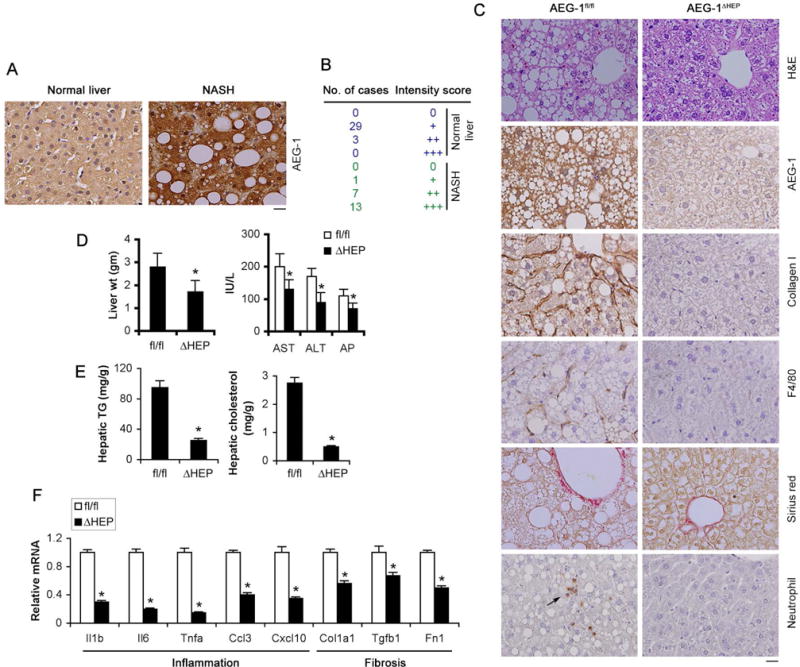
Figure 3.

AEG-1 is overexpressed in NASH patients and AEG-1ΔHEP mice are resistant to HFD-induced NASH. A. AEG-1 immunostaining in livers of normal individual and NASH patients. B. Quantification of AEG-1 staining intensity in normal and NASH livers. (Pearson’s χ2 test: p<0.0001). C. H&E, IHC staining with the indicated antibodies and picrosirius red staining in FFPE sections of livers of AEG-1fl/fl and AEG-1ΔHEP littermates fed HFD for 22 wks. D–F. Liver weight (D, left panel), serum levels of liver enzymes (D, right panel), hepatic TG and cholesterol levels (E) and mRNA levels of inflammatory and fibrotic genes in the liver by Q-RT-PCR (F) were measured in HFD-fed AEG-1fl/fl and AEG-1ΔHEP littermates at the end of the study. The indicated mRNA levels were normalized by levels of corresponding chow-fed littermates. AEG-1fl/fl: n = 9. AEG-1ΔHEP: n = 10. A and C: representative images; magnification 400×; scale bar: 20 μm. D–F, data represent mean ± SEM. * : p<0.01.
