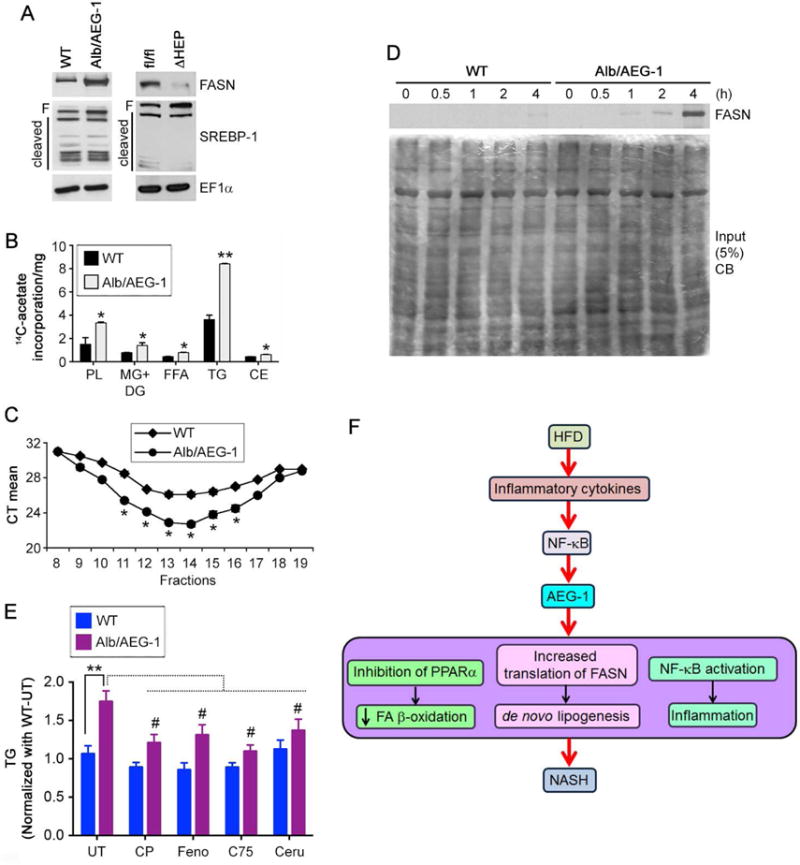
Figure 6.

AEG-1 induces de novo lipogenesis. A. Western blotting for the indicated proteins in WT, Alb/AEG-1, AEG-1fl/fl and AEG-1ΔHEP livers. EF1α was used as loading control of each blot and one representative of such control is shown. B. De novo lipogenesis was measured by 14C-acetate incorporation assay. PL: phospholipid; MG: monoglyceride; DG: diglyceride; FFA: free fatty acid; TG: triglyceride; CE: cholesterol ester. Data represent mean ± SEM of three independent experiments. * : p<0.05, ** : p<0.01. C. RNA was extracted from fractions of WT and Alb/AEG-1 hepatocytes centrifuged through a sucrose gradient and subjected to Fasn mRNA level analysis by Q-RT-PCR. Fractions 9–16 typically represent the polysomal fractions. CT: cycle threshold. Data represent mean ± SEM of three independent experiments. *: p<0.05. D. WT and Alb/AEG-1 hepatocytes were labeled with 35S-methionine for the indicated time-points and 500 μg of protein per sample was used to immunoprecipitate FASN. Top, autoradiogram of the immunoprecipitates. Bottom, Coomassie blue (CB) stain of 5% of input. E. WT and Alb/AEG-1 hepatocytes were either untreated or treated with CP775146 (2.5 μM), Fenofibrate (5 μM), C75 (10 μg/ml), or cerulenin (10 μg/ml) and TG level was measured. Data represent mean ± SEM of three independent experiments. **: p<0.001 between UT groups; #: p<0.05 between untreated and treated Alb/AEG-1 hepatocytes. F. Cartoon depicting the molecular mechanism by which AEG-1 is induced in NASH and AEG-1 promotes NASH.
