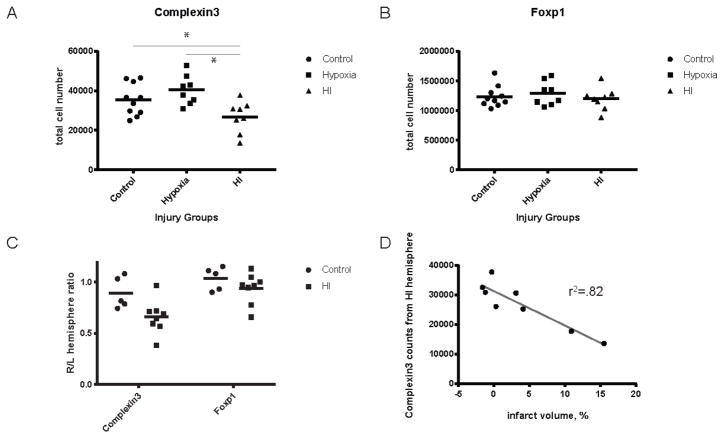
Figure 4. Quantification of Complexin3 and Foxp1 across injury groups at P8.
Complexin3+ subplate population in HI group is significantly decreased compared to control and hypoxia group (A, p =0.0177 and p= 0.0015). Foxp1+ cell numbers are not significantly different between injury groups (B). Hemispheric (right/left) ratios of Complexin3 and Foxp1 counts show a greater variability in the injured groups, compared to controls (C). Complexin3 cell counts in HI hemisphere are negatively correlated with infarct volume as defined by (infarct volume = (hypoxia - hypoxia-ischemia)/hypoxia) (D, r2=0.82, p=0.0017).

