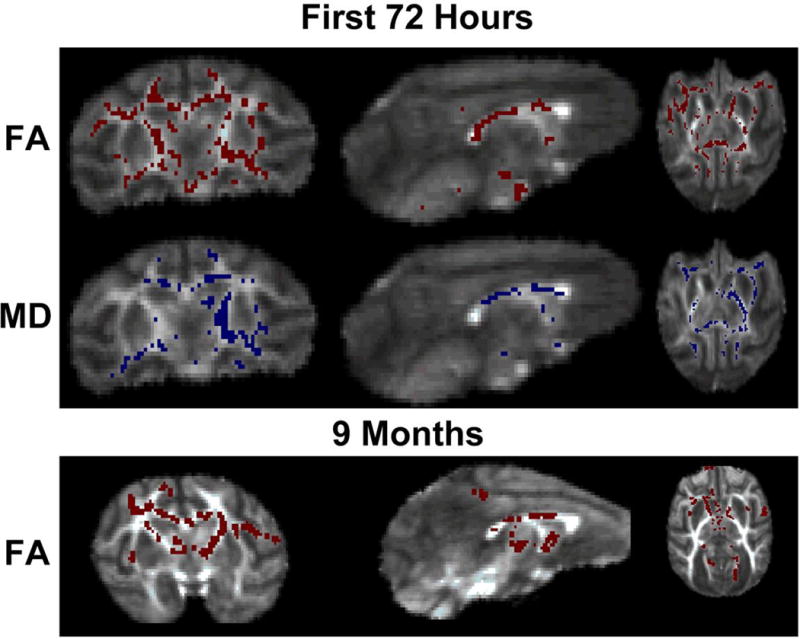
Figure 5.

Tract-Based Spatial Statistics images show the average fractional anisotropy (FA) image of the subjects with red areas representing increased signal in control animals compared to animals with CP (p<0.05). Scans performed in the first 72 hours demonstrated decreased FA in the corpus callosum, anterior and posterior limbs of the internal capsule, as well as multiple other white matter tracks in the animals with CP (6 CP and 4 control). Blue areas represent regions of increased mean diffusivity (MD) in CP animals compared to controls (p<0.05). At nine months, animals with CP continued to have decreased FA in the same areas as found during the MRI taken within the first 72 hours of age (6 CP and 5 control).
