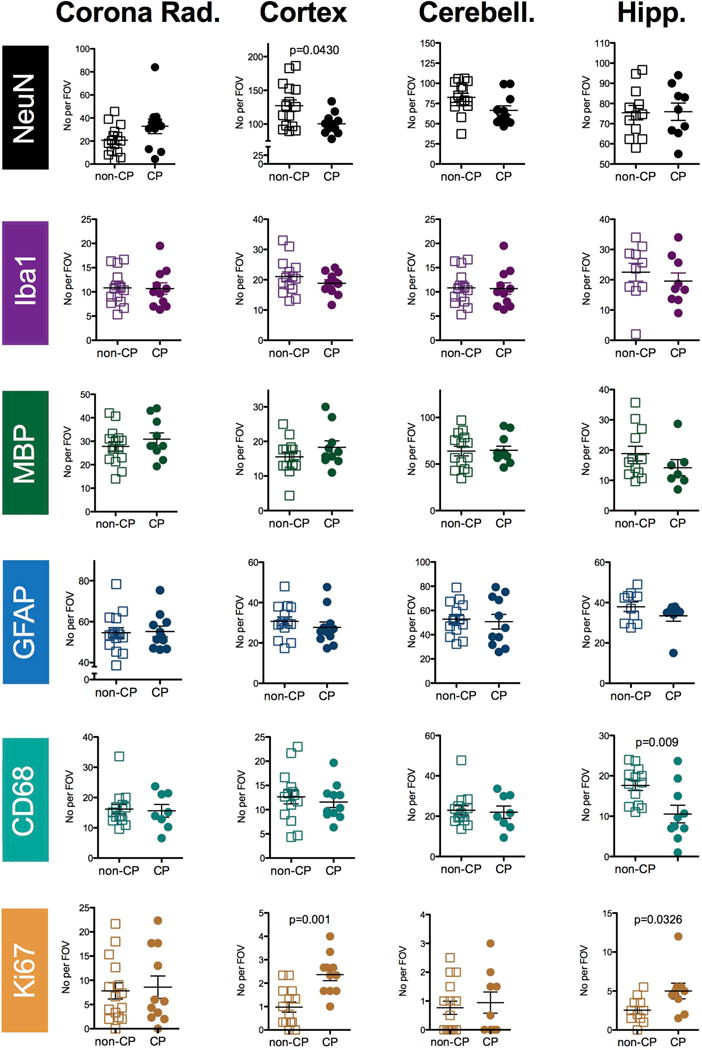
Figure 7.

Scatter plots of the data from the immunohistochemical staining separated by outcome. Data from animals diagnosed with no CP or mild CP (‘non-CP’) versus animals diagnosed with moderate or severe CP (CP) for the corona radiate (Corona Rad.), the Cortex, the cerebellum (cerebell.) and the hippocampus (Hipp.) as outlined in Figure 2. Groups were compared with a Mann-Whitney U test and p values <0.05 are indicated on the graphs.
