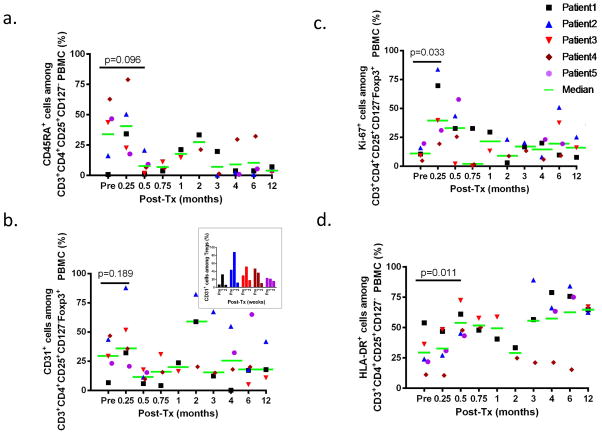
Figure 4.
a. The percentages of CD45RA+ cells in CD4+CD25+CD127−Foxp3+ cells in CD3+CD4+ cells are shown for Patients 1 to 5. b. The percentages of CD31+ cells in CD4+CD25+CD127−Foxp3+ cells in CD3+CD4+ cells are shown for Patients 1 to 5. The inset shows the percentage of CD31+ cells in CD4+CD25+CD127−Foxp3+ cells from the pretransplant time point until week 2 post-transplant. c. The percentages of Ki-67+ cells in CD4+CD25+CD127−Foxp3+ cells in CD3+CD4+ cells are shown for Patients 1 to 5. d. The percentages of HLA-DR+ cells in CD4+CD25+CD127−Foxp3+ cells in CD3+CD4+ cells are shown for Patients 1 to 5.

