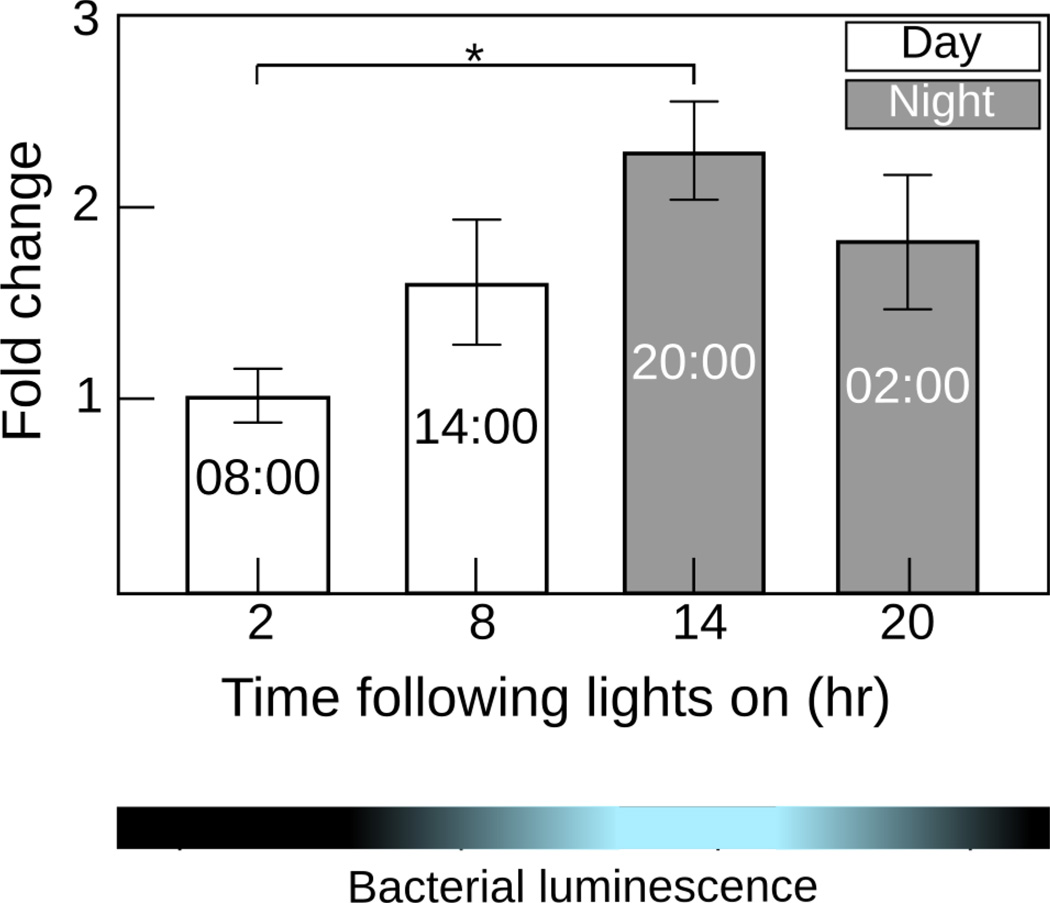
Figure 5.
Regulation of es-crumbs in mature light organs sampled over the day-night cycle. The fold change on the y-axis represents data normalized to the time point of lowest expression. The blue and black bar denotes the cycle of V. fischeri luminescence within the light organ. Data consist of two to six biological replicates each with two technical replicates pooled per condition. Error bars for both graphs are standard error of the mean (*, 0.01< P<0.05).

