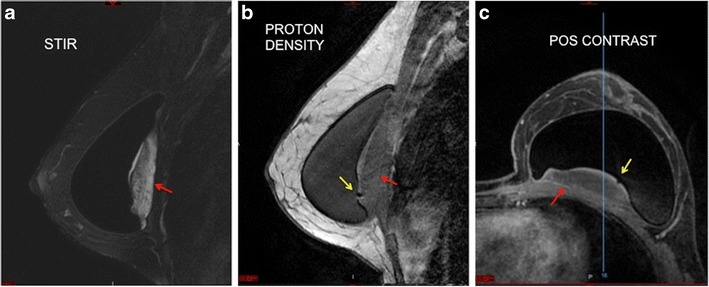
Fig. 6.

Black drop sign (a, b, c). Mass with a heterogeneous hypersignal posterior to the breast implant at STIR (red arrow) (a). Black signal focus (black drop sign) at the interface between the implant and the granuloma at proton density imaging (yellow arrow) (b). Post-contrast phase demonstrating the black drop sign (yellow arrow). We can see the late phase enhancement of the mass (red arrow) (c). A 38-year-old female with an implant for 2 years
