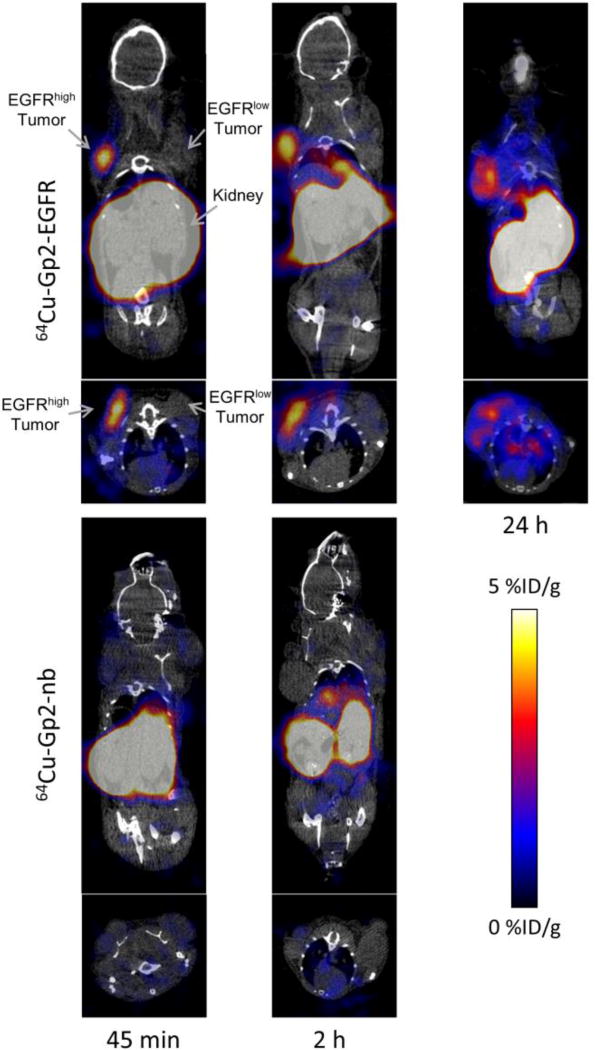
Fig. 4. PET/CT imaging.
Coronal and axial micro-PET/CT images of anesthetized athymic nude mice bearing subcutaneously xenografted A431 tumors (EGFRhigh) in the left shoulder and MDA-MB-435 tumors (EGFRlow) in the right shoulder. The mouse in the 24 h image lacks a MDA-MB-435 tumor. Mice were injected by tail vein with 0.6-2.6 MBq of either 64Cu-Gp2-EGFR (top row) or, the non-targeted control, 64Cu-Gp2-nb (bottom row). Five minute static PET scans followed by CT scans were acquired at 45 min (left), 2 h (middle), and 24 h (right, for targeted Gp2 only) post-injection. Image planes were selected such that both tumors appear in the image.

