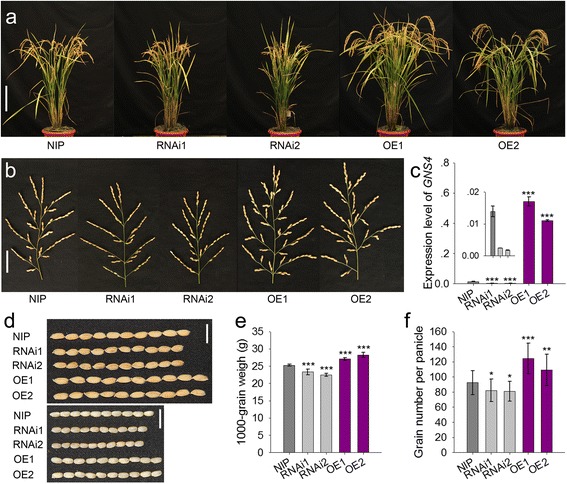
Fig. 3.

RNAi and overexpression analysis of GNS4 gene in Nipponbare background. a Phenotypic features of GNS4 RNAi and overexpression transgenic plants. Bar, 20 cm. b Panicle architecture of GNS4 RNAi and overexpression transgenic plants. Bar, 5 cm. c GNS4 mRNA expression level of the RNAi and overexpression transgenic plants. The expression level of the rice Actin gene was amplified as a control. Values are means ± s.e. of four independent experiments. d Grains of the transgenic plants. Bar, 1 cm. e-f Comparison of 1000-grain weight and grain number per plant between Nipponbare and transgenic lines. Data are given as means ± s.e. (n ≥ 13). Significant at ***0.1%, **1% and *5%. NIP, Nipponbare. RNAi1 and RNAi2 are two independent lines for RNAi analysis, and OE1 and OE2 are two independent lines for overexpression analysis
