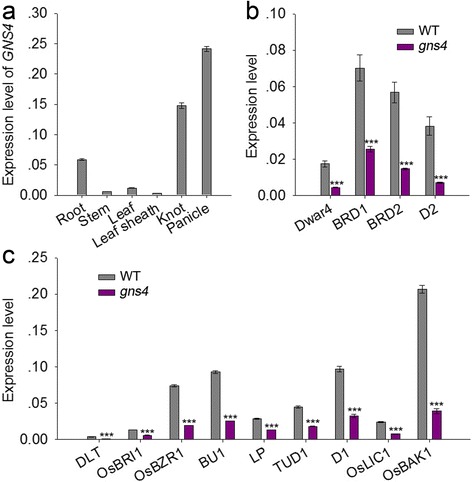
Fig. 6.

Expression analysis of GNS4 by qRT-PCR. a Relative expression levels of GNS4 in different tissues. b Comparison of transcription level of genes involved in rice BR biosynthesis between WT and gns4 mutant. c Relative transcription levels of the genes related to BR signaling in WT and gns4 mutant. The expression level of the rice Actin gene was amplified as a control. Values are means ± s.e. of four independent experiments
