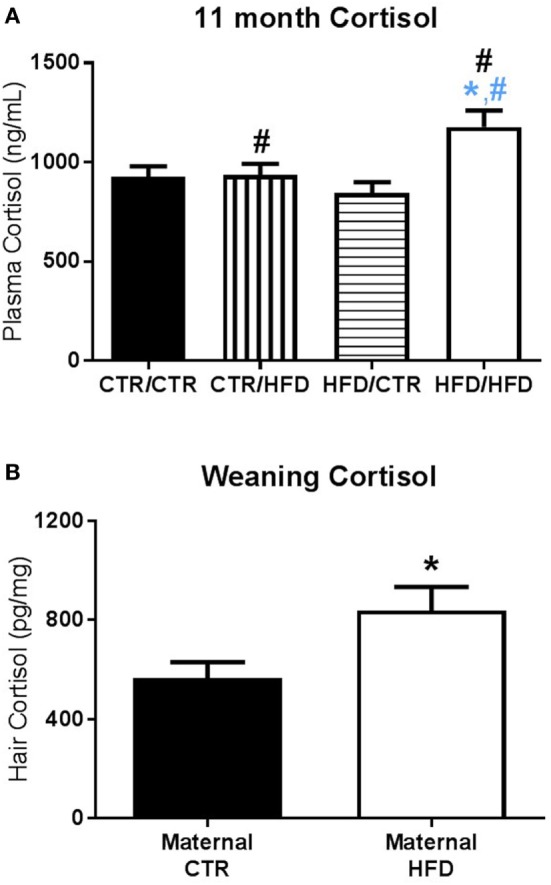
Figure 6.

(A) Plasma cortisol measured after the 11-month behavior test increased with postweaning high-fat diet (HFD) exposure (F1,83 = 6.729, p = 0.011). Post-test cortisol was also affected by an interaction between maternal and postweaning diet (F1,83 = 5.772, p = 0.019), with the HFD/HFD group increased from HFD/CTR (F1,83 = 12.966, p = 0.001) and from CTR/HFD (F1,83 = 5.489, p = 0.022). Sample sizes for 11-month plasma cortisol are as follows: CTR/CTR n = 27 (n = 13 males; n = 14 females), CTR/HFD n = 18 (n = 11 males; n = 7 females), HFD/CTR n = 25 (n = 12 males; n = 13 females), and HFD/HFD n = 21 (n = 9 males; n = 12 females). (B) At weaning, offspring exposed to a maternal HFD displayed higher hair cortisol than controls (F1,46 = 4.406, p = 0.041). Sample sizes for weaning hair cortisol are as follows: maternal CTR n = 20 (n = 11 males; n = 9 females), maternal HFD n = 17 (n = 10 males; n = 7 females). Data shown as mean ± SEM. A black * denotes maternal diet effect and a black # denotes a postweaning diet effect, p < 0.05. A blue * denotes maternal diet effect when controlling for postweaning diet and a blue # denotes a postweaning diet effect when controlling for maternal diet, p < 0.05.
