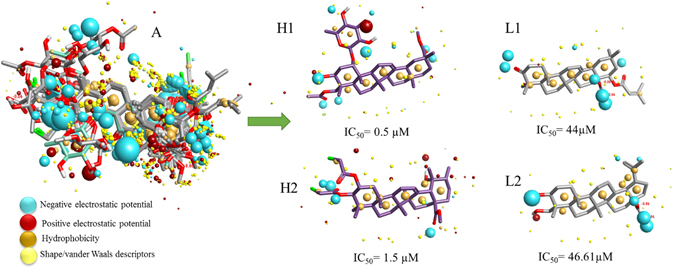
Figure 2.

(A) Molecular representation of aligned training set compounds with their respective field points. (B) Molecular representation of two highly active training set compounds (H1 and H2) and two low active training set compounds (L1 and L2) with their respective biological activity (IC50) and molecular field points especially the electrostatic potential regions. Blue color shows negative field points, which indicates likely molecular regions interacting with positive or H-bond donors of target protein, red color shows positive field points, which indicates likely molecular regions interacting with negative or H-bond acceptors of target protein, gold or orange color shows hydrophobic field points, which indicates the regions with high polarizability or hydrophobicity, and yellow color shows van der Waal field points, which indicates the regions with possible surface.
