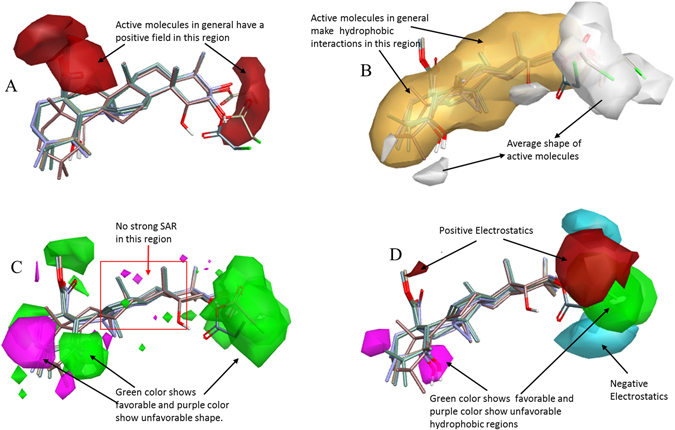
Figure 6.

Molecular insight of SAR mechanism models, revealing the different lead optimization sites of active compounds including maslinic acid, as detected through an average of actives and activity cliffs summary studies. (A) Red color shows positive field region controlling the activity. High red color region means, higher the activity. (B) White color region shows the average shape of active compounds and yellow color shows hydrophobic interactions sites required for activity. (C) Green color shows favorable region, purple color shows unfavorable shape region, and red square shows no strong SAR region. (D) Red color indicates positive electrostatics region and cyan color indicates negative electrostatics region. Higher the red and cyan color region means higher the activity. Green color shows favorable and purple color shows unfavorable hydrophobic regions controlling the activity.
