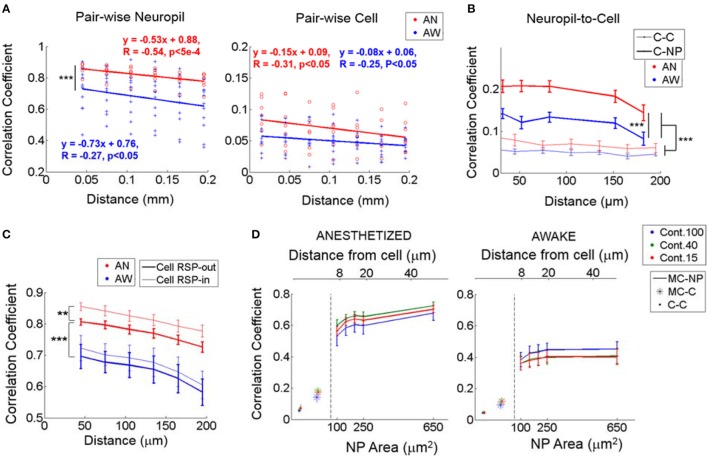
Figure 4.
Noise correlations during identical visual stimulation. (A) Noise correlation between neuropil-patches (left; from ΔF/F response) and between cells (right; from estimated spikes) as a function of distance. In (A), each value marked with either a red circle (anesthetized) or a blue cross (awake) represent the mean correlation across all pairs belonging to the corresponding distance bin within an FOV. Bin size = 30 μm. While neuropil coefficients decay at a steeper slope than cell coefficients, (P < 0.05, t-test for the two independent slopes), regardless of brain state, the relative (%) decrease over the same distance is ~2 times larger for cells (~23% for cells vs. ~12% for neuropil patches). (B) Noise correlation between neuropil-patches (from ΔF/F response) and cells (from estimated spikes) as a function of distance (bold line, C-NP). “C-C” refers to pairwise cell-to-cell noise correlations. Error bars indicate mean ± SEM at distances used across FOVs. For (A,B), ***indicates P < 1e-7 in Wilcoxon rank-sum test. (C) Linear contribution of single-cell response to neuropil-patch noise correlation. Mean noise correlations between neuropil patches were compared before and after subtracting corresponding single cells' responses (see Section Materials and Methods). **, ***P < 5e-5, P < 1e-8, Wilcoxon rank-sum test. “Cell RSP-in”: without linear subtraction. “Cell RSP-out”: after linear subtraction. Our basic observations remain unchanged after this correction. (D) Mean noise correlations between individual cells (C-C), between single cells and the mean response from all other cells except the cell itself (MC), and between the mean cell response (MC) and neuropil patches (NP) as a function of neuropil patch size and its distance from the centered cell. “X-Y”, represents noise correlation between “X” and “Y”; for example, MC-NP, correlation between MC and NP. AN, Anesthesia, AW, Quiet wakefulness. Cont.: Visual contrast. Cell responses were measured from deconvolved spike rates. In plots, solid line (with error bar) represents the mean (with SEM) across FOV's (n = 7 and 11 from anesthetized and awake animals, respectively).

