Figure 5.
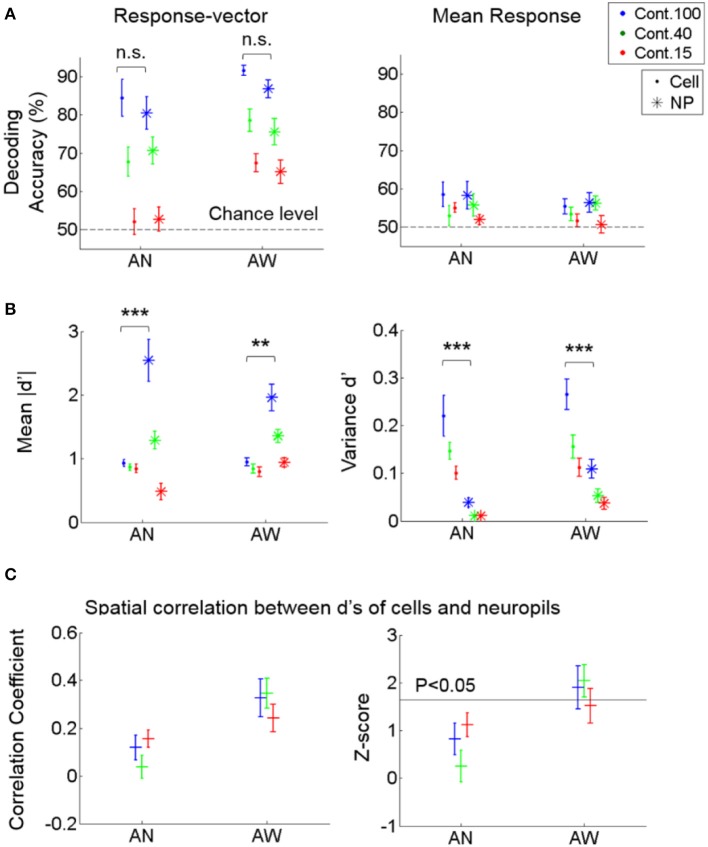
Decoding performance of cell vs. neuropil responses for stimulus direction. (A) Decoding accuracy from response vectors composed of cells vs. neuropil-patches (left) and from the mean response across cells vs. neuropil-patches within FOV's (right). Decoding accuracy was not significantly different for neuropil-patch vs. somatic response-vectors regardless of brain state (not significant in Two-way ANOVA). Response-averaging across population elements dropped the decoding performance to near chance level for both cells and neuropil patches. (B) Mean of absolute d' values (left) and variance of d' values (right) within each FOV, averaged across FOV's. d': discriminability between vertical vs. horizontal grating conditions for single cell or neuropil-patches. On average, while the mean of absolute d' values within an FOV is larger for neuropil-patches than for cells, the variance of d' values is smaller across neuropil-patches. **, ***P < 5e-4, 1e-7 in Two-way ANOVA. (C) Spatial correlation between the d's of cells vs. their local neuropil-patches (left) and the corresponding z-score (right; see Section Materials and Methods). Cell and neuropil patch d' vectors are significantly spatially correlated only in the quiet awake state (P < 0.05). In all plots, “.” stands for cell, “*” for neuropil, “+” represent the overall mean across FOVs, and error bars SEM across FOVs (n = 7, 11 for anesthetized and awake animals). AN, Anesthesia, AW, Quiet wakefulness.

