Figure 1.

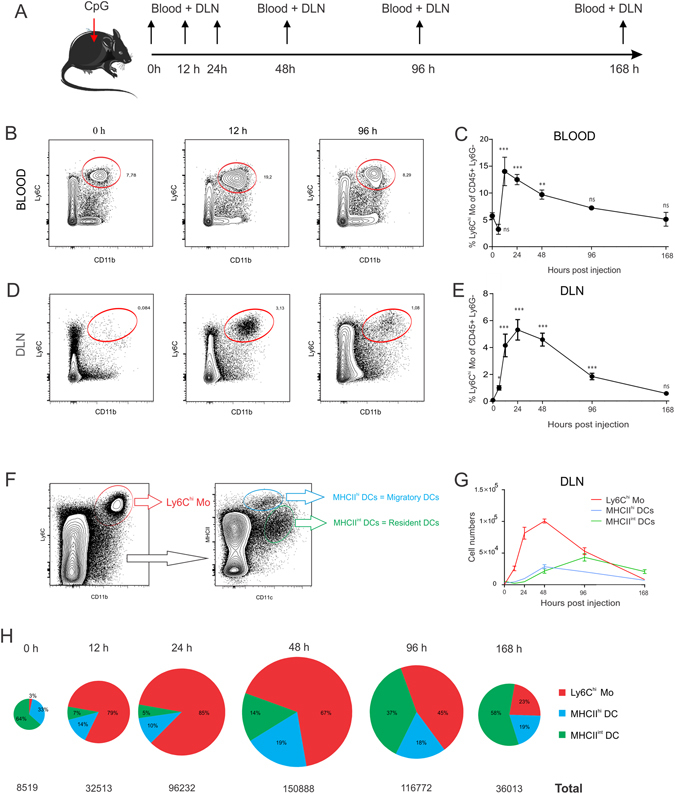
Subcutaneous CpG injection mobilizes Ly6Chi Monocytes and DCs. (A) C57Bl/6 mice (n = 4) were injected in the footpad with 20 µl of CpG (100 µg/ml) and blood samples and draining popliteal lymph nodes were analysed at the indicated time intervals by flow cytometry. (B,D) Flow cytometry plots showing the frequency of Ly6Chi Monocytes in blood (B) and draining lymph node (D) of CpG injected mice at 0 h, 12 h and 96 h post CpG injection. (C,E) Graph showing the frequency of Ly6Chi monocytes in blood (C) and draining lymph nodes (E) of CpG injected mice (as percentage of CD45+ Ly6G− leukocytes) over time. Mean values at each time interval where compared to mean values at steady state (0 h) ***P < 0.001, **p < 0.01, *p < 0.05. (F) Gating strategy applied to identify migratory DCs and resident DCs in popliteal lymph nodes. (G) Graph showing the absolute numbers of Ly6Chi monocytes, migratory DCs and resident DCs in the draining lymph nodes of OVA/CpG injected lice at the indicated time intervals (n = 4; mean +/− SD). (H) Pie charts depicting the relative proportions of Ly6Chi monocytes, migratory DCs and resident DCs in the draining lymph nodes. The area of the circles displayed is relative to the added counts of Ly6Chi monocytes, migratory DCs and resident DCs at the indicated time intervals. Data shown are representative of three independent experiments.
