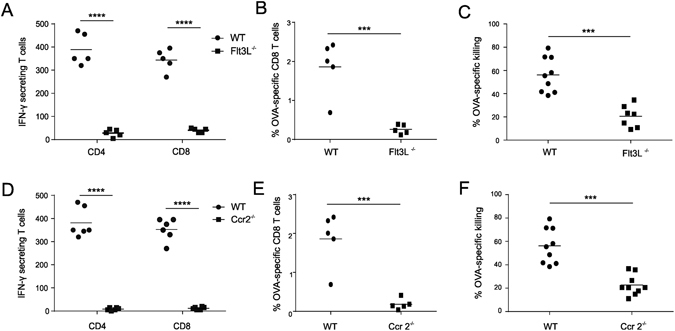
Figure 2.

Flt3L−/− mice and Ccr2−/− mice show impaired effector T cell responses. Analysis of the effector T cell response to OVA/CpG vaccination. (A–C) Comparison of effector T cell responses between WT and Flt3L−/− mice. (D–F) Comparison of effector T cell responses between WT and Ccr2−/− mice. (A,D) ELISPOT analysis determining the numbers of IFN-γ secreting T cells (n = 6; mean +/− SD). (B,E) Flow cytometric quantification of OVA-specific CD8 T cells in blood (n = 5/group; mean +/− SD). (C,F) OVA-specific cytotoxicity as measured by an in vivo killing assay (n = 7/group; mean +/− SD). ****P < 0.0001, ***p < 0.001. Data shown are representative of three independent experiments.
