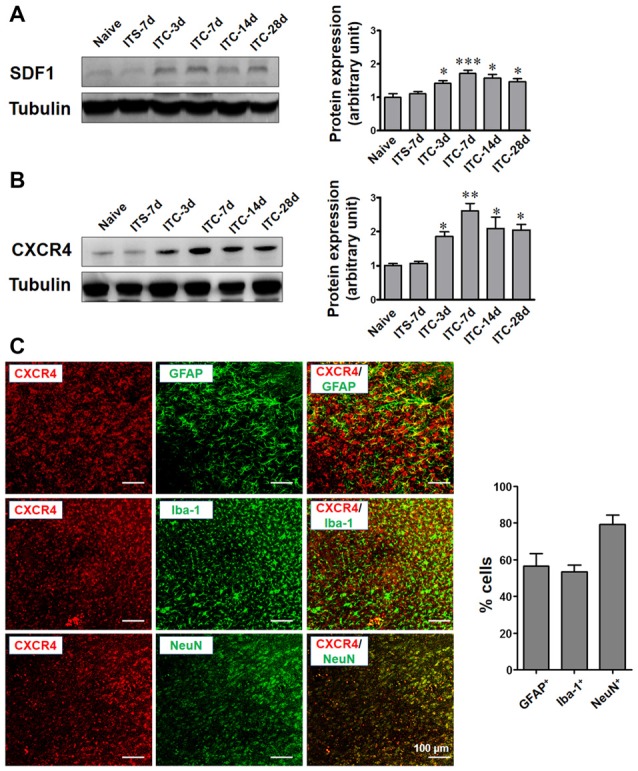
Figure 4.

Temporal and spatial changes in SDF1 and CXCR4 expression in peri-thalamic lesion sites under CPSP condition. (A) Western blot assay showing the time course expression of SDF1 following thalamic hemorrhage. Representative bands are shown on the left, and data summary is shown on the right. *P < 0.05, ***P < 0.001 vs. ITS group. (B) Western blot assay showing the time course expression of CXCR4 following thalamic hemorrhage. Representative bands are shown on the left, and data summary is shown on the right. *P < 0.05, **P < 0.01 vs. ITS group; n = 4/group. (C) Left panel showing the immunofluorescence micrographs of the double-staining of CXCR4 with GFAP, Iba-1 and NeuN. Right panel quantifying the percentages of GFAP-positive, Iba-1-positive and NeuN-positive cells expressing CXCR4. Scale bar, 100 μm.
