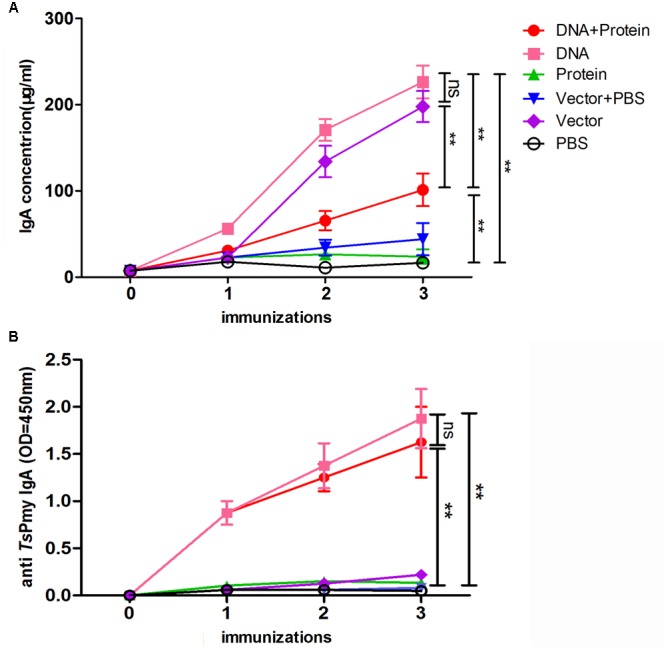
FIGURE 2.

The secretion of total sIgA (A) and TsPmy specific sIgA (B) in the lavage fluid of intestines of mice in different regimens measured by modified ELISA. Results are the mean ± standard deviation (SD) for five individual mice per group. The TsPmy specific sIgA level is shown using OD450 value. ∗∗p < 0.01 between two groups; ns, not significant.
