
Figure 1.
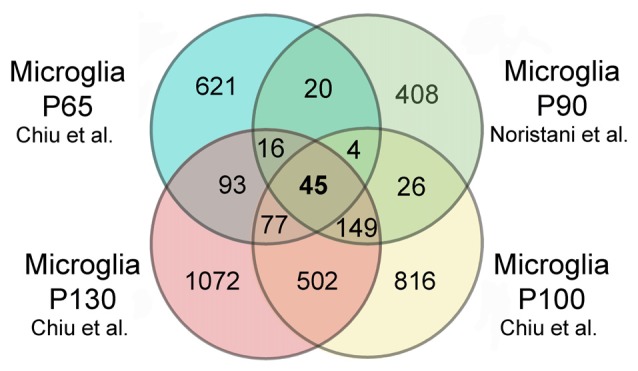
In silico comparison of gene dysregulation in super oxide dismutase 1 (SOD1)G93A microglia. Data compared are from the original publications of Chiu et al. (2013) and Noristani et al. (2015). Venn diagrams showing that 45 genes are commonly dysregulated in SOD1G93A microglia at all time points in both studies, corresponding to 0.9% of the dysregulated genes. Brca1 is amongst these 45 genes. A total of 5117 genes were identified as dysregulated, 621 genes are uniquely dysregulated in hSOD1G93A microglia at P65, 408 at P90, 816 at P100, and 1072 at P130. 1.17% of the identified genes are commonly dysregulated at P65 and P90; 4.4% are commonly modified at P90 and P100 and, 15% are commonly dysregulated at P100 and P130. In the study of Chiu et al. (2013) microglia were isolated by FACS from the whole SOD1G93A spinal cord and RNA sequencing (RNA-Seq) was used. In the study of Noristani et al. (2015) microglia were isolated by FACS from the lumbar segment of the SOD1G93A spinal cord and microarrays were used. P65 correspond to onset/early symptomatic phase, P90 early symptomatic, P100 symptomatic and P130 the end stage of the disease. Thresholds to select the genes were identical in the two studies with a fold change >2 and p value (FDR) <0.05.