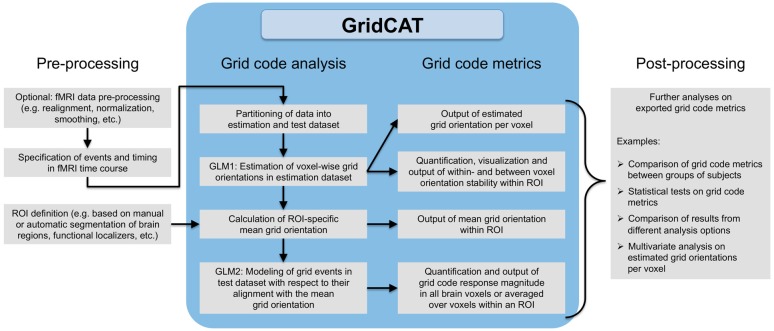
Figure 3.
Grid code analysis pipeline. All that is required to perform a grid code analysis are functional brain images (which, depending on the user’s wishes, may have undergone standard fMRI data preprocessing such as smoothing etc.) together with a file detailing events of interest during the fMRI time course and their corresponding timing information. The GridCAT partitions these data into an estimation dataset and a test dataset, offering multiple options as to how to split the data depending on the experimental design and the user’s needs. Using the estimation dataset, the GridCAT then estimates voxel-wise grid orientations of the grid code in a first general linear model (GLM1). As a result, voxel-wise grid orientations are stored and can be plotted using the GridCAT’s specific plotting options to visualize grid code stability both within and between voxels, or can be exported in several formats for further analysis such as group level analyses, statistical testing, or multivariate analysis methods. Moreover, within any region of interest (ROI), the GridCAT can calculate an ROI-specific mean grid orientation, providing that the mask image (e.g., anatomically or functionally defined) and functional data are registered to one another. Finally, in a second GLM (GLM2) the GridCAT allows events in the test dataset to be modeled with respect to their alignment with the ROI-specific mean grid orientation, in order to quantify the grid code response magnitude individually for all brain voxels or averaged over voxels within an ROI. All results and grid code metrics can be exported for further use with statistical and neuroimaging analysis tools of the researcher’s choice.

