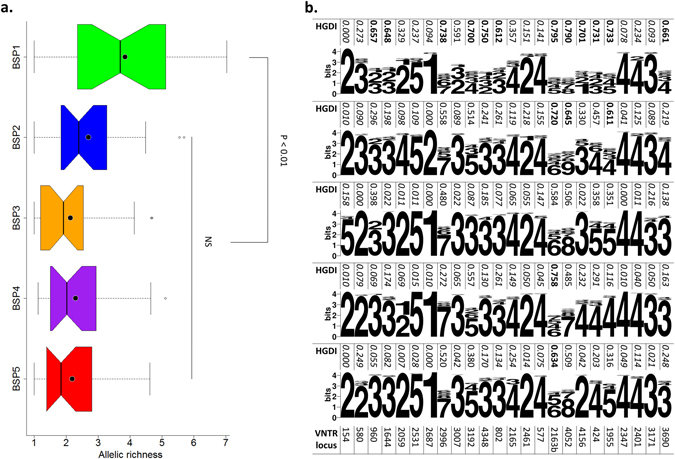
Figure 2.

The mean allelic richness of 24-loci MIRU-VNTRs and WebLogo representation to visualize main patterns observed for BSPs. (a) Allelic richness of different BSPs. Notched boxes correspond to median values ± quartiles of allelic richness, while the dots and bars within notched boxes correspond to the mean and median values. Dotted lines adjacent to the boxes show the minimum/maximum values. Note that comparison tests as well as P values were estimated based on mean values by t-test. (b) WebLogo of allele copy number of 24-loci MIRU-VNTRs loci in each BSP grouping. The allelic diversity of the loci was classified as highly discriminant (HGDI > 0.6, bold in the table), moderately discriminant (0.3 ≤ HGDI ≤ 0.6, normal) and poorly discriminant (HGDI < 0.3, italic).
