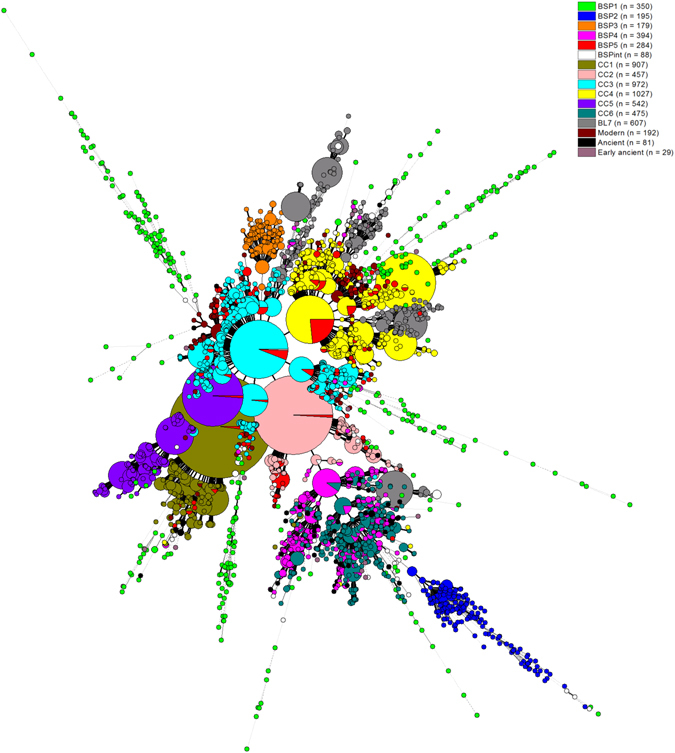
Figure 3.

A minimum spanning tree (MST) based on pooled data on Beijing isolates (n = 6779 strains). The combined MST highlights evolutionary relationships of different Beijing groups from the present study on BSP groupings (BSP1 n = 350, BSP2 n = 195, BSP3 n = 179, BSP4 n = 394, BSP5 n = 284, BSPint n = 88; total 1490 strains), classification of a series of clonal complexes (CCs) defined by Merker et al.19 in a global study (CC1 n = 907, CC2 n = 457, CC3 n = 972, CC4 n = 1027, CC5 n = 542, CC6 n = 475, BL7 n = 607; total n = 4987 strains), and a recent study describing 3 groups based on evolutionary history of Beijing isolates in China countrywide by Yin et al.20, as Modern n = 192, Ancient n = 81, Early ancient n = 29; total n = 302 strains); the complexity of the lines denotes the number of allele/spacer changes between two patterns: solid lines (1 or 2 or 3 changes), gray dashed lines (4 changes) and gray dotted lines (5 or more changes); the size of the circle is proportional to the total number of isolates sharing same pattern.
