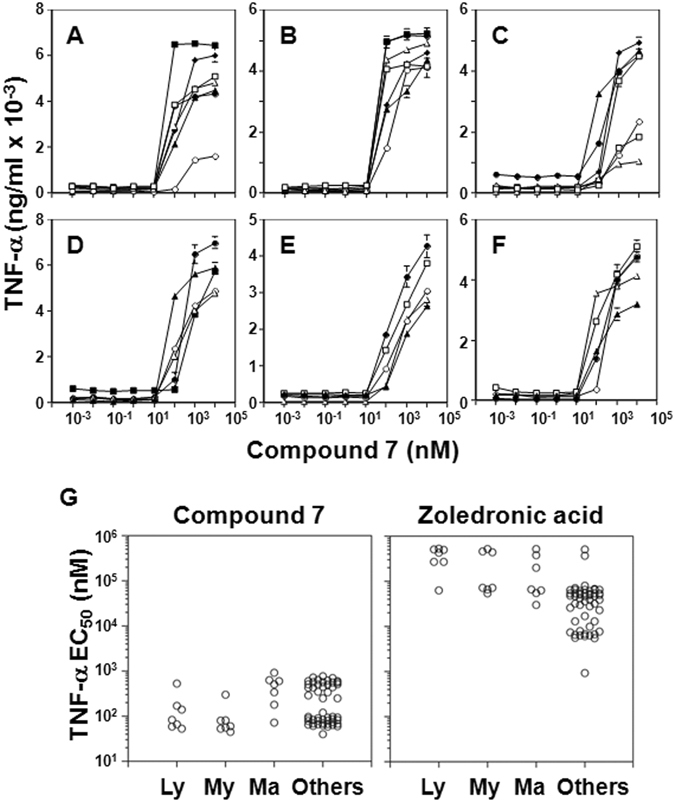
Figure 3.

Stimulation of TNF-α secretion from γδ T cells by tumor cells pretreated with compound 7. (A–F) Stimulation of TNF-α production by γδ T cells in response to compound 7 pretreatment of various tumor cell lines; (A) lymphomas, ▫ MOLT-3, ∆ PEER, ⚪C1R, ⬧J.RT3-T3.5, ▪ Raji, ▴ RAMOS-RA1, ⚫MOLT-4; (B) myeloid leukemias, ▫ HL60, ∆ U937, ⚪THP-1, ⬧ SCC-3, ▪ P31/FUJ, ▴ K562,⚫ NOMO-1; (C) mammary carcinomas, ▫ YMB-1-E, ∆ MRK-nu-1, ○ HMC-1-8, ⬧ MCF-7, ▪ MDA-MB-231, ▴T-47D, ⚫ SK-BR-3; (D) renal cell carcinomas, ▴ 786-0, ∆ VMRC-RCZ, ⚫ UOK121, ⚪ Caki-1, ▪ A-704; (E) pancreatic carcinomas, ⚫ BXPC-3, ▴ KP4-1, ⚪ KP4-2, ▫ KP4-3, ∆ MiaPaCa2; (F) other tumor cells, ⚫ TGB24TKB cholangiocell carcinoma, ▴ ACS gastric carcinoma, ⚪ MG63 osteocarcoma, ▫ LK-2 lung carcinoma, ∆ C32TG melanoma. (G) Comparison of compound 7 (left panel) with zoledronic acid (right panel) concentrations used to pretreat tumor cells for half-maximal stimulation of TNF-α production by Vγ2Vδ2 T cells. Ly = lymphomas, My = myeloid leukemia, Ma = mammary carcinomas, and Others = other tumor cell lines. Details of zoledronic acid stimulation of Vγ2Vδ2 T cells are from Idrees et al.46 and are included for comparison.
