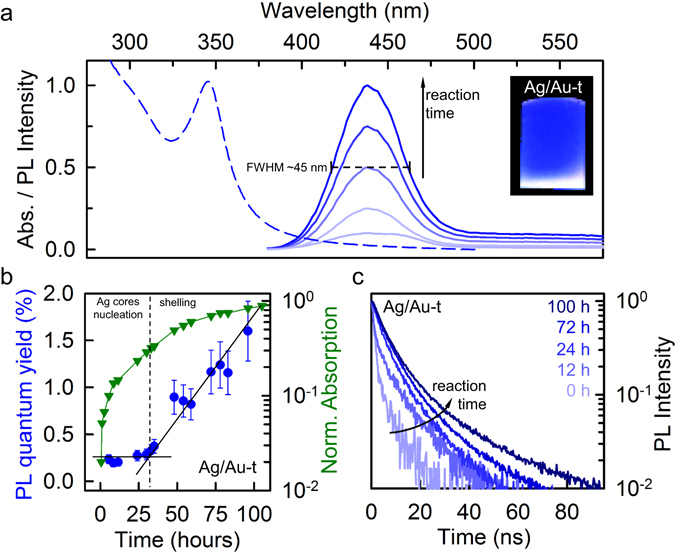
Figure 3.

(a) Absorption and PL spectrum of protected Ag clusters (Ag/Au-t) dispersion in water. The intensity of the emission increases with the reaction time. The inset is a digital picture of the dispersion under UV lamp excitation. (b) PL quantum yield (circles), normalized absorption (triangles) and (c) time-resolved PL decay traces at 435 nm as function of the reaction time. All measurements were performed at room temperature using a 355 nm pulsed laser as excitation source, with an excitation fluence of 130 μJ/cm2.
