Figure 4.

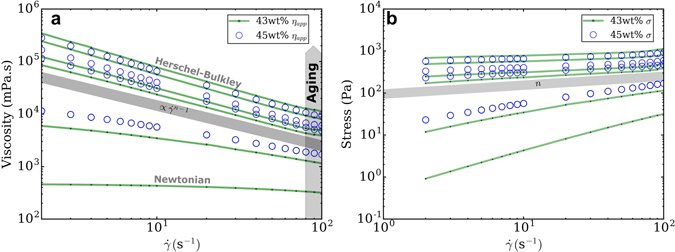
Evolution of viscosity η app (a) and stress σ (b) as a function of shear rate for 43 and 45 wt% suspension at respectively t aging = 0, 6, 16, 21, 44, 96 h and t aging = 0, 5, 8, 25 h, from bottom to top for both plots.

Evolution of viscosity η app (a) and stress σ (b) as a function of shear rate for 43 and 45 wt% suspension at respectively t aging = 0, 6, 16, 21, 44, 96 h and t aging = 0, 5, 8, 25 h, from bottom to top for both plots.