Figure 8.

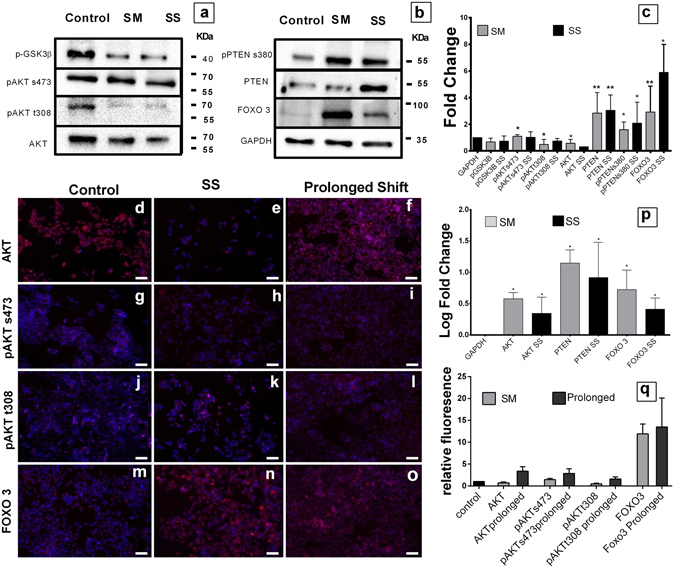
The PTEN/FOXO3/AKT axis regulation under microgravity. Images of Western blot for AKT pathway proteins; phosphorylated GSK-3β serine 9, phosphorylated AKTserine 473, phosphorylated AKT threonine 308 and total AKT of control, Microgravity simulated and SM cells shifted to normal gravity for 4 days (SS) (a). Western Blot images of phosphorylated PTEN serine 308, PTEN, FOXO3 and GAPDH (b). Representative graph normalized using GAPDH; black bars represent SS and lighter bars represent SM (c). Data represented as mean + S.D. statistical analysis using Mann Whitney t test *P < 0.05, **P < 0.005. Fluoresecnt images of DLD1 cells stained with PE conjugated secondary against AKT, pAKTs473, pAKTt308 and FOXO3, nucleus counterstained with DAPI, control (d,g,j,m) respectively and SS cells (e,h,k,n) and SM cells prolonged in static for longer period 2 months (f,i,l,o) scale bar = 200 μm. qPCR analysis of Gene expression of AKT, PTEN, FOXO genes against GAPDH as housekeeping in control vs SM and SS, represented in log fold change of mean + S.D. *P < 0.05 (p). Graphical representation for the images (d–o) showing relative fluorescence intensity between control, SS and prolonged shift cells (q).
