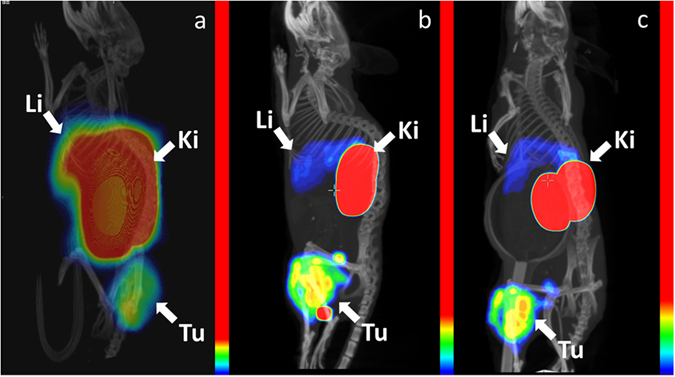
Figure 4.

Imaging of mice bearing A431 xenografts. PET/CT using 68Ga-DOTA-ZEGFR:2377 at 3 h after injection (a) and SPECT/CT using 57Co-DOTA-ZEGFR:2377 at 3 h (b) and 24 h (c) after injection. The images show three-dimensional volume rendering of PET or SPECT data overlaid CT data. The images were rotated to provide view of liver. The relative colour scales were normalized to the highest activity and then adjusted to provide first red pixel in tumours (8, 13 and 17% of the full scale, for Fig. 4a,b and c, respectively). Arrows point at tumours (Tu), kidneys (Ki) and livers (Li).
