
Figure 1.
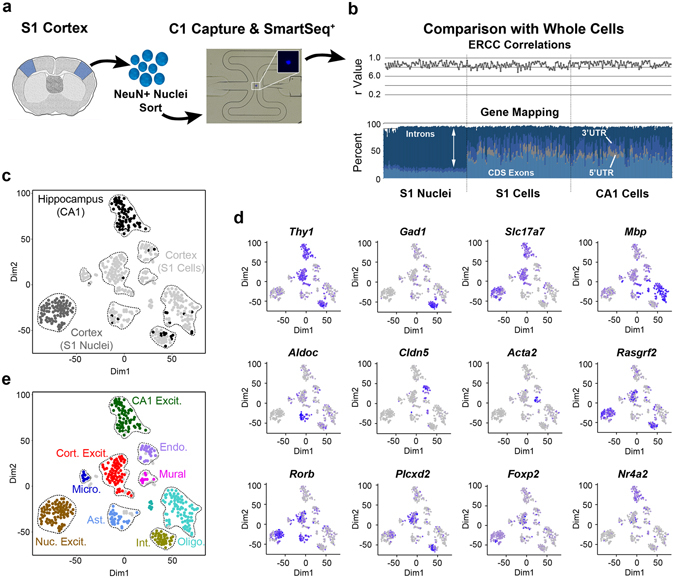
SNS reveals excitatory neuron identity. (a) Overview of the SNS pipeline. S1 mouse cortex was dissociated to single nuclei for NeuN+ and DAPI+ sorting and capture on C1 chips for modified SmartSeq (SmartSeq+) reactions. Inset shows DAPI positive nuclei in the C1 capture site. (b) Comparison of nuclear data sets with 100 random single S1 cortical or CA1 hippocampal data sets2. Top panel: Pearson correlation (r) coefficients for comparison of ERCC TPM values with their input quantities. Bottom panel: proportion of genomic reads mapping to coding sequences (CDS Exons), introns, or untranslated regions (3′ or 5′ UTRs). (c) t-SNE plots showing cluster distribution of hippocampal CA1, cortical S1 cells and cortical S1 nuclei. (d) t-SNE plots as in (c) showing positive expression levels (low – gray; high – blue) of cell type marker genes for oligodendrocytes (Mbp), astrocytes (Aldoc), endothelial cells (Cldn5), mural cells (Acta2), neurons (Thy1), inhibitory neurons (Gad1), excitatory neurons (Slc17a7), and excitatory neuron subtypes Rasgrf2 (layer 2–3), Rorb (layer 4), Plcxd2 (layer 5), FoxP2 (layer 6) and Nr4a2 (layer 6b)2, 29. (e) t-SNE plots showing expected identity of cluster groupings based on markers in (d) (Table S1, ambiguous data sets defined in Methods are shown in gray).