
Figure 5.
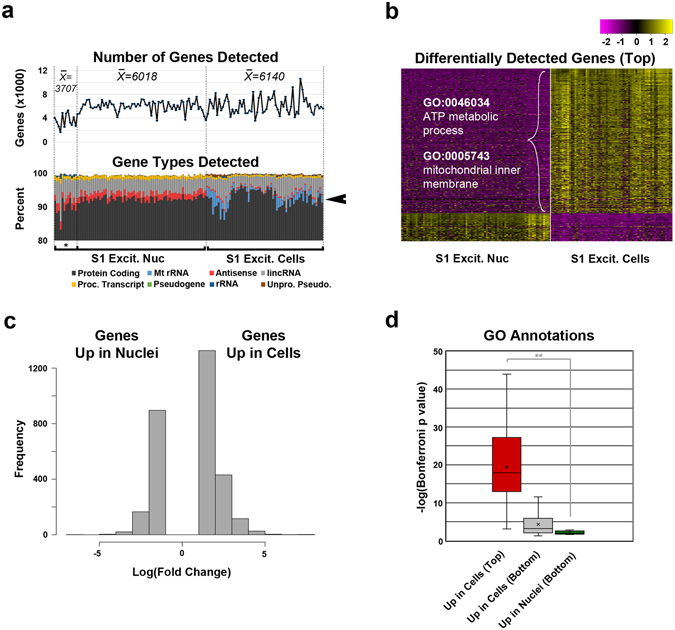
Differential transcript abundances between nuclei and whole cells. (a) Top panel: Total number of genes detected (count ≥ 4) from nuclei (*Indicates data sets generated from sorted nuclei frozen prior to C1 loading) and whole cell data sets representing S1 excitatory neurons. Lower panel: percentage of gene types detected, showing slightly more antisense transcripts detected in nuclear data and slightly more mitochondrial (Mt) rRNA detected in cellular data (arrow). (b) Heatmap of expression for top differentially detected genes (p < 1 × 10⁻²⁰) between cellular and nuclear data sets showing representative GO annotations for genes over-represented in cells. (c) Histogram showing a higher frequency of genes that were better detected in cellular compared to nuclear data sets for S1 excitatory neurons (Supplementary Table S3). (d) Box plot showing significance values for annotations of top (p < 1 × 10⁻²⁰) and bottom (p ≥ 1 × 10⁻²⁰) differentially detected genes (Biological Process and Cellular Component categories, Supplementary Tables S4–S5). Student t-test p value is indicated: **p = 0.0002.