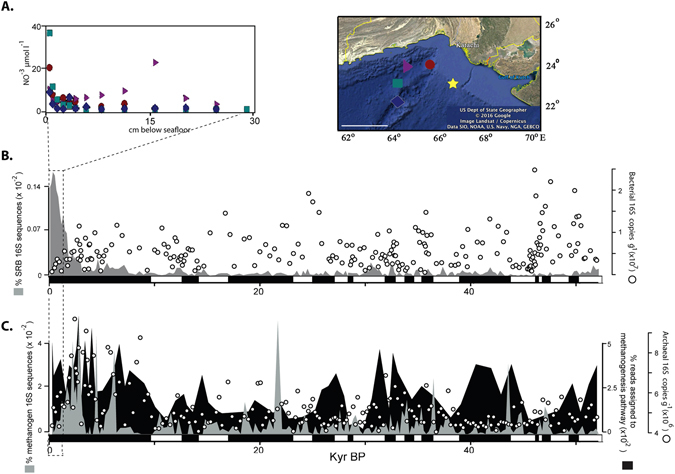
Figure 2.

(A) Penetration of nitrate into the sediment surface at four nearby sites (data from Sokoll et al.)62. Star in map indicates location of the core from our study, and colored symbols indicate core locations from Sokoll et al.62. Scale bar: 200 km, map was created using the Google Earth software. (B) Relative abundance of 16S rRNA genes (percentage of total reads per sample) assigned to sulfate reducing bacterial (SRB) taxa across the 214 samples are shown in the grey shaded area plot, and total bacterial 16S rRNA genes as estimated by qPCR are displayed as white circles. Black and white rectangles on the x axis represent sapropelic and TOC depleted intervals, respectively. (C) Relative abundance of 16S rRNA genes (percentage of total reads per sample) assigned to methanogenic archaeal taxa across the 214 samples are shown in the grey shaded area plot. Relative abundances of the methanogenesis pathways in the 72 metagenomes (percentage of total reads per sample) are shown in the black shaded area plot. Total archaeal 16S rRNA genes as estimated by qPCR are shown as white circles. Note the depletion of nitrate in the top 5 cm, followed by a peak in SRB, which is directly followed by a peak in 16S rRNA genes from methanogenic archaea. Black and white rectangles on the x axis represent sapropelic and TOC depleted intervals, respectively.
