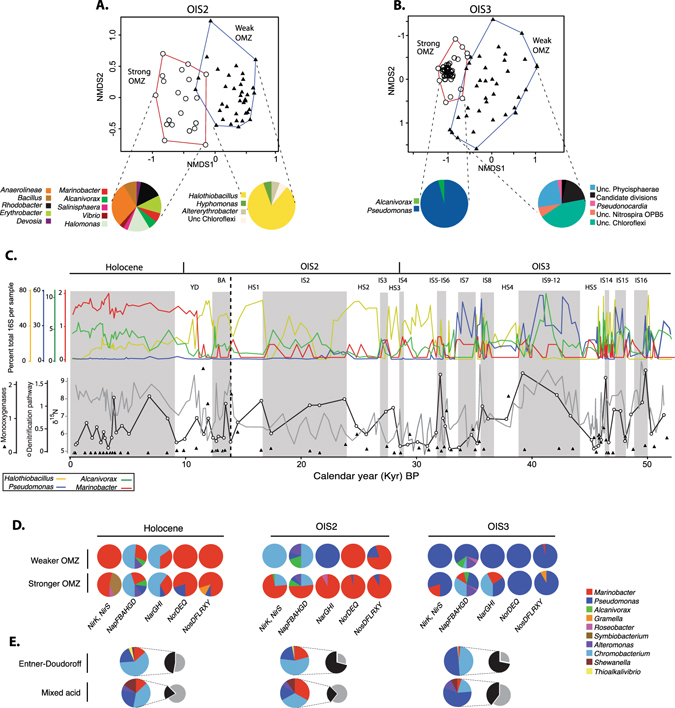
Figure 4.

(A,B) Non-metric multidimenstional scaling analysis of bacterial 16S rRNA genes identified as indicator taxa through ISA analysis in OIS2 and OIS3. Pie charts show the distribution of significant indicator taxa for strong and weak OMZ periods, pie slices are proportional to the number of OTUs assigned as indicator taxa. NMDS stress values for OIS2 and OIS3 were 0.14 and 0,17, respectively. Note that despite being separated by depth, indicator taxa in sapropelic intervals (white circles) are significantly (P = 0.001) different compared to those in bioturbated, organic poor intervals (black triangles). (C) Top panel: 16S rRNA gene stratigraphy of Halothiobacillus, Marinobacter, Alcanivorax, Pseudomonas taxa (relative abundance). Scale shows percent sequences assigned to each taxon per sample. Bottom panel: stratigraphy of the single copy gene normalized abundance of the denitrification pathway (averaged values for Nir, Nap, Nar, Nor, Nos) in unamplified metagenomes (white dots), together with δ15N (grey line). Triangles display the average normalized abundance of monooxygenase gene homologs. The scales for monooxygenases and denitrification show the average abundance of the genes (either denitrification pathway, or monooxygenases) normalized against the averaged abundance of universally conserved single copy genes49. Shaded regions indicate sapropelic layers (strong OMZ) with increased TOC preservation, whereas un-shaded regions indicate bioturbated intervals deposited under higher bottom water oxygen concentrations (see Fig. 1A). The vertical dashed line indicates the onset of the deglacial period. (D) Taxonomic affiliation of denitrification genes during the three major climate stages. (E) Taxonomic affiliation of genes encoding the mixed acid and Entner-Dourdoroff fermentation pathways (colored pie charts). Pie charts to the right show the relative abundance of Gammaproteobacterial genera encoding the two fermentation pathways (black color), and all other bacterial genera encoding the same pathways (grey color).
