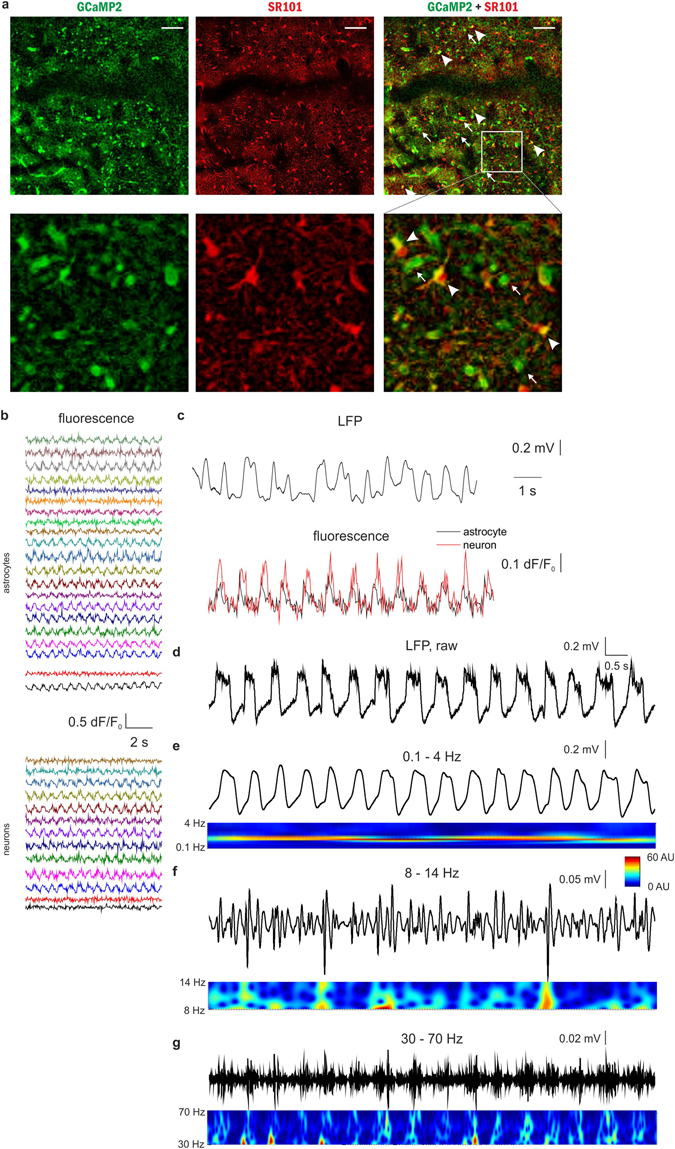
Figure 3.

Both astrocytes and neurons are active during UP states in vivo in the rat primary visual cortex V1. (A) Top: Expression of GCaMP2 (green), labeling of astrocytes with SR101 (red). Both neurons (some marked by arrows) and astrocytes (some marked by arrowheads) express GCaMP2. Bottom: Zoomed-in image of the area marked by white rectangle at the top row. Scale bars: 100 µm. (B) 10-sec segments of ∆F/F0 fluorescent intensity traces of all identified astrocytes (n = 21) and neurons (n = 13) in the imaged area. (C) Simultaneous recording of local field potential (LFP, filtered at 0.1–4 Hz) and corresponding Ca2+ transients in a neuron (black) and an astrocyte (red) during SWA under ketamine-xylazine anesthesia. (D–G) Characteristic LFP activity in the slow wave (0.1–4 Hz), spindle (8–14 Hz) and gamma (30–70 Hz) frequency ranges as filtered LFP recordings (top) and their wavelet transformations (bottom). All data were recorded from the V1 area of a P76 rat (n = 15 imaging session, 60 s each).
