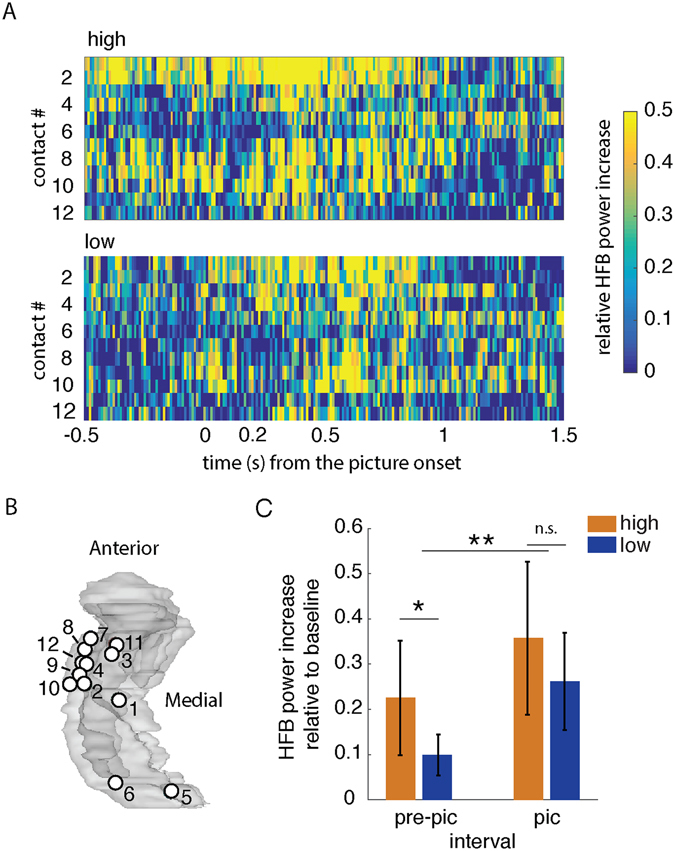
Figure 2.

HFB power during pre-picture and picture intervals. (A) Averaged HFB power in −0.5 s to 1.5 s from the picture onset (irrespective of the RT) for the high-expected condition (top panel) and the low-expected condition (bottom panel). The HFB power in each trial was relative to the baseline (0.5 s before sentence onset). Each row shows the HFB power in a contact. X-axis is time from onset of the picture. Y-axis is the contact number (see Table 1). (B) Map of contacts corresponding to (A) in a glass hippocampus. Contacts 5 and 6 were located in the right hippocampus, but are shown in the left glass hippocampus for illustration. (C) Average HFB power increase relative to the baseline during the pre-picture interval (0.5 s gap between the offset of the last word from the sentence and the picture onset) and picture interval (0.2 s from onset of the stimuli to RT). The HFB power during the picture interval was more than the power during the pre-picture interval (**P < 0.001). During the pre-picture interval HFB power was more in the high-expected condition than in the low-expected condition (*P < 0.05). The error-bars show the standard deviations and n.s. denotes not significant.
