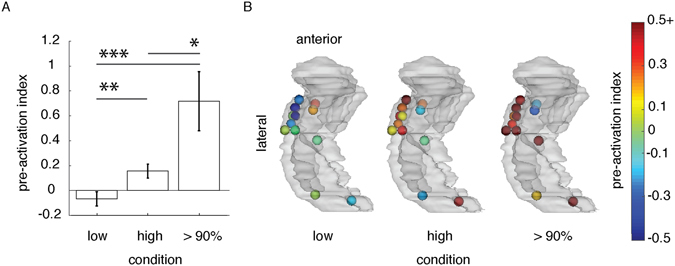
Figure 3.

Pre-activation indexes (A) for the high-expected and low-expected trials, and a subset of high-expected trials for which the picture stimuli were predictable with more than 90% certainty. The error-bars show the standard error of the mean. *P < 0.05, **P < 0.01, *** = P < 0.001. (B) a left glass-hippocampus shows the topography of contacts and the values of pre-activation index as shown in (A). Contacts are color-coded by the pre-activation index value which ranged between −0.5 to 0.5 + (the pre-activation indices above 0.5 are color-coded in dark red).
