Figure 1.

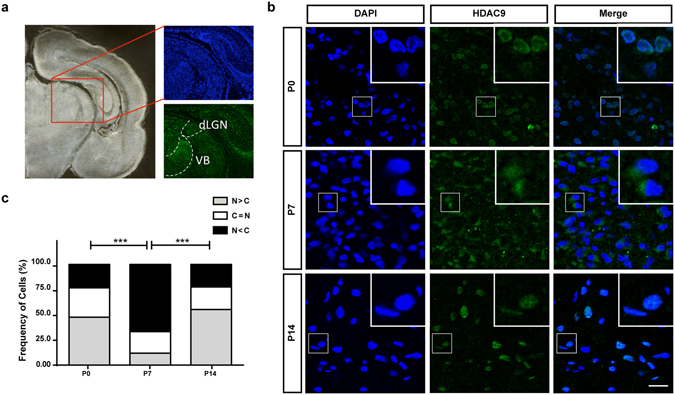
HDAC9 translocation in the developing rat thalamus. (a) Locations of dLGN and VB are shown in a coronal section. (b) P0, P7 and P14 rat thalami were analyzed after immunohistochemistry against HDAC9. HDAC9 export from the nucleus can be observed by the end of the first postnatal week. Scale bar: 35 μm Green: HDAC9. Blue: DAPI. (c) Distribution of the cells according to the ratio of HDAC9 signal intensity in the cytoplasm normalized to its nuclear intensity. Cells in which the cytoplasm/nuclear signal ratio was below 0.9 were considered as having a nuclear signal (N > C). Cells that the average signal in the nucleus and the cytoplasm did not differ in more than 10% (i.e. ratios between 0.9 and 1.1) were categorize as N = C. Cells in which the signals in the cytoplasm were considerably higher than in the nucleus (ratios above 1.1) were categorized as N < C. N = 958, 2029 and 808 cells from 3 different animals for P0, P7 and P14, respectively. Statistical analysis by overall Chi-square (Chi = 898.7, with 4 degrees of freedom, p < 0.0001) followed by pairwise Chi-square with Bonferroni correction. ***p < 0.001.
