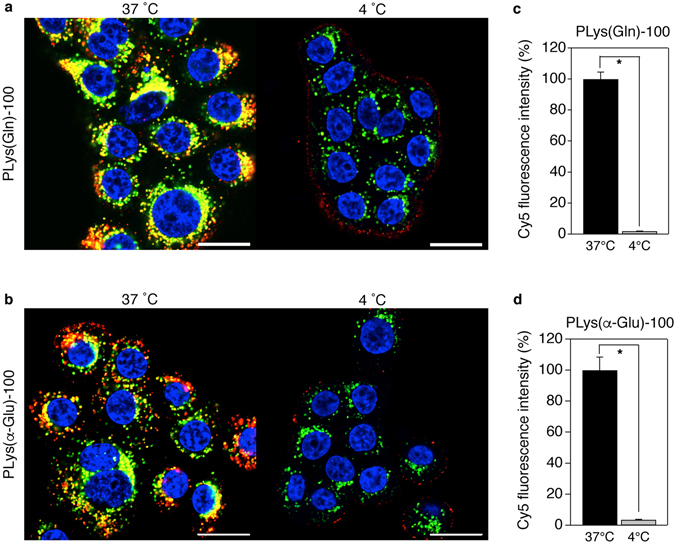
Figure 5.

Subcellular distribution of PLys(Gln)-100 and PLys(α-Glu)-100. (a,b) Confocal laser scanning microscopic images of BxPC3 cells after 3 h treatment with PLys(Gln)-100 (a) and PLys(α-Glu)-100 (b) at 37 °C (left) and 4 °C (right). Red, Cy5-labeled polymers; green, late endosome/lysosome; blue, nucleus. Scale bar, 20 μm. (c,d) Cy5 fluorescence intensities of BxPC3 cells after 3 h treatment with PLys(Gln)-100 (c) and PLys(α-Glu)-100 (d) at 37 °C and 4 °C. The cells were analysed using flow cytometer. Data are mean ± S.D. (n = 3). p* < 0.001 (Student’s t-test).
