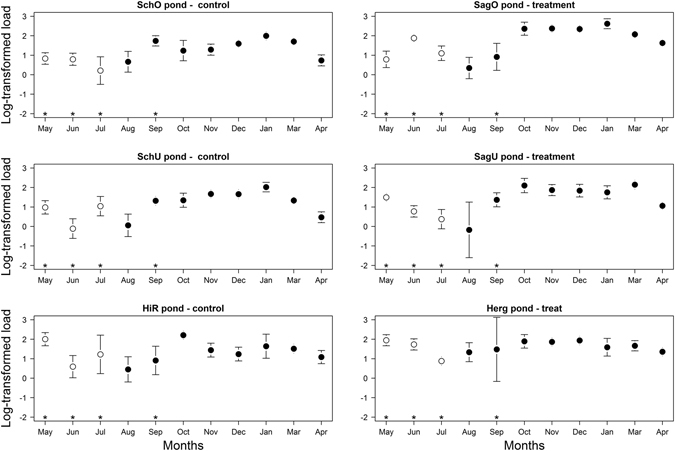
Figure 2.

The mean log10-transformed Bd zoospore load of the Bd-infected A. obstetricans tadpoles is shown for each of the six ponds and the eleven months in the study. The control ponds and the antifungal-treated ponds are in the left and right columns, respectively. The 2010 and 2011 cohorts are shown in white and black, respectively. Fungicide treatment was applied to tadpoles in the months of May, June, July, and September (asterisks). Uninfected tadpoles were not included in the calculation of the mean Bd zoospore load. The bars show the 95% confidence limits of the mean.
