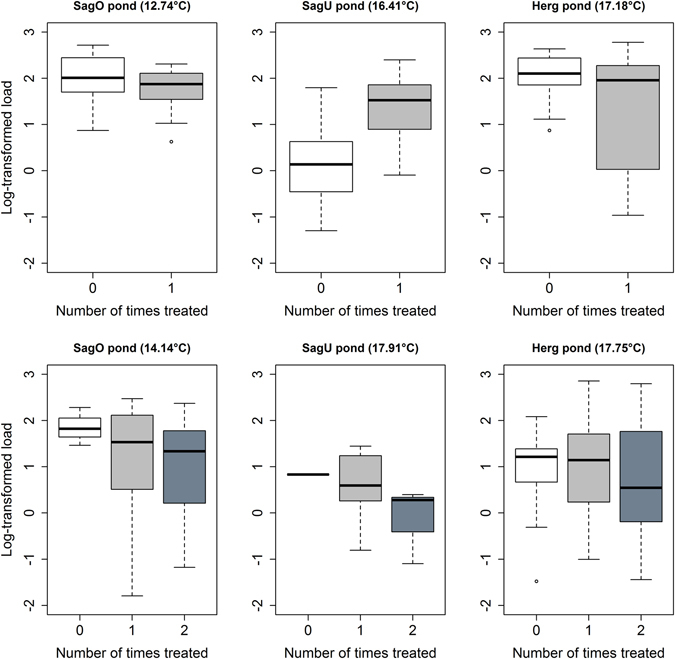
Figure 3.

For the 2010 cohort of A. obstetricans tadpoles captured in June 2011 (top row) and July 2011 (bottom row), the log10-transformed Bd zoospore loads are shown as a function of the number of fungicide applications to individual tadpoles for each of the three treated ponds. The mean pond temperatures for the 30 days prior to capture are shown in brackets after the pond name. Shown are the medians (black lines), the upper and lower quartiles (edges of the box), the minimum and maximum values (whiskers), and the outliers (circles) for each pond.
