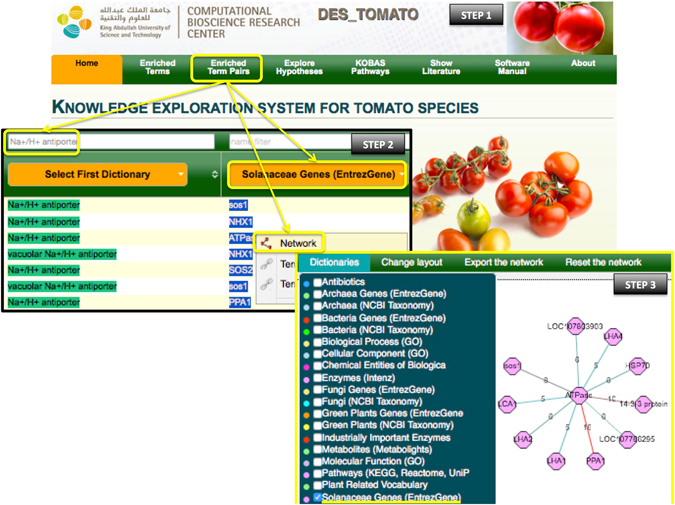
Figure 3.

Step-by-step illustration of how DES-TOMATO can be used to find relevant candidate genes involved in salinity tolerance by focusing on Na+ homeostasis and plasma membrane H+-ATPases (in yellow). In the network, the pink octagons represent the “Solanaceae Genes” dictionary. The edge color is distributed across a color spectrum from hot/red (high frequency co-occurrence/strong association) to cold/blue (small number of co-occurrences, weaker association). The numbers on the edges provide the number of publications that link the associated nodes.
