
Fig. 3.
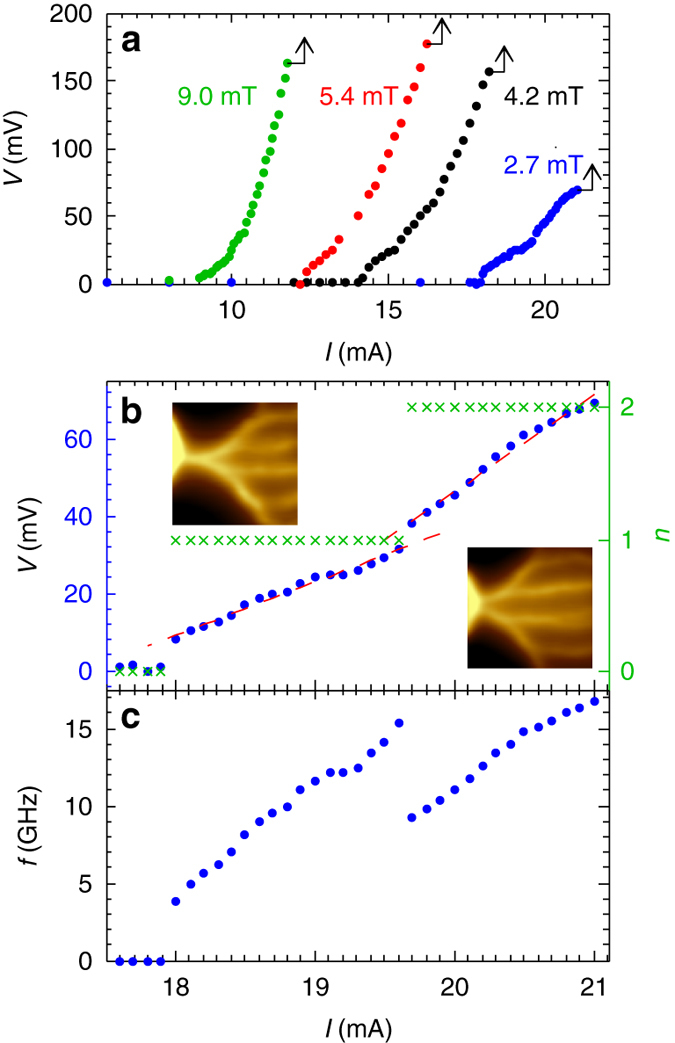
Current-voltage-frequency characterization of vortex penetration. a Voltage V across the microbridge as a function of current I for various indicated fields. b Voltage across the bridge (blue) and the number of vortex stems n (green) as a function of current at B a = 2.7 mT. The red dashed lines are linear fits with dV/dI = 13.9 mΩ in the single stem and 25.1 mΩ in double stem regions. The insets show zoomed-in SOT images of single stem and double stem vortex flow. c Vortex penetration rate f per stem vs. current I