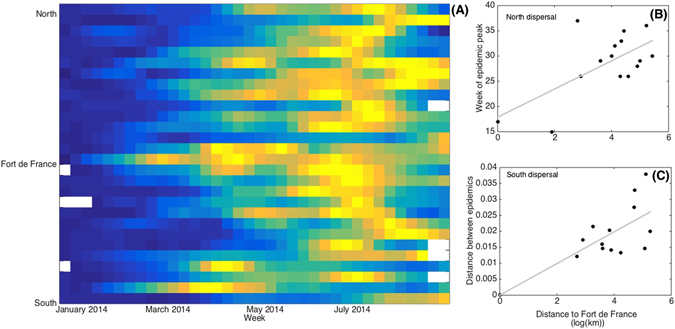
Figure 1.

Summary of the spatio-temporal dynamics of the 2014 Chikungunya outbreak in Martinique and its two spatial waves. (A) Colors represent the local scaled incidence rate (ranking from 0 in dark blue to 1 in hot yellow) for each locality (rows), ranked from the extreme south to the extreme north of the island according to its position from Fort-De-France, and each week (column). White color represent lack of data. Two waves appear from Fort-De-France, northwards and southwards. Geographic distance (log of km) between different localities through road (x-axis) and (B) the week of the epidemic peak (r = 0.6454, p-value = 0.0094) and (C) the Euclidean distance between the whole time series (r = 0.72, p-value = 0.0037).
