Figure 2.

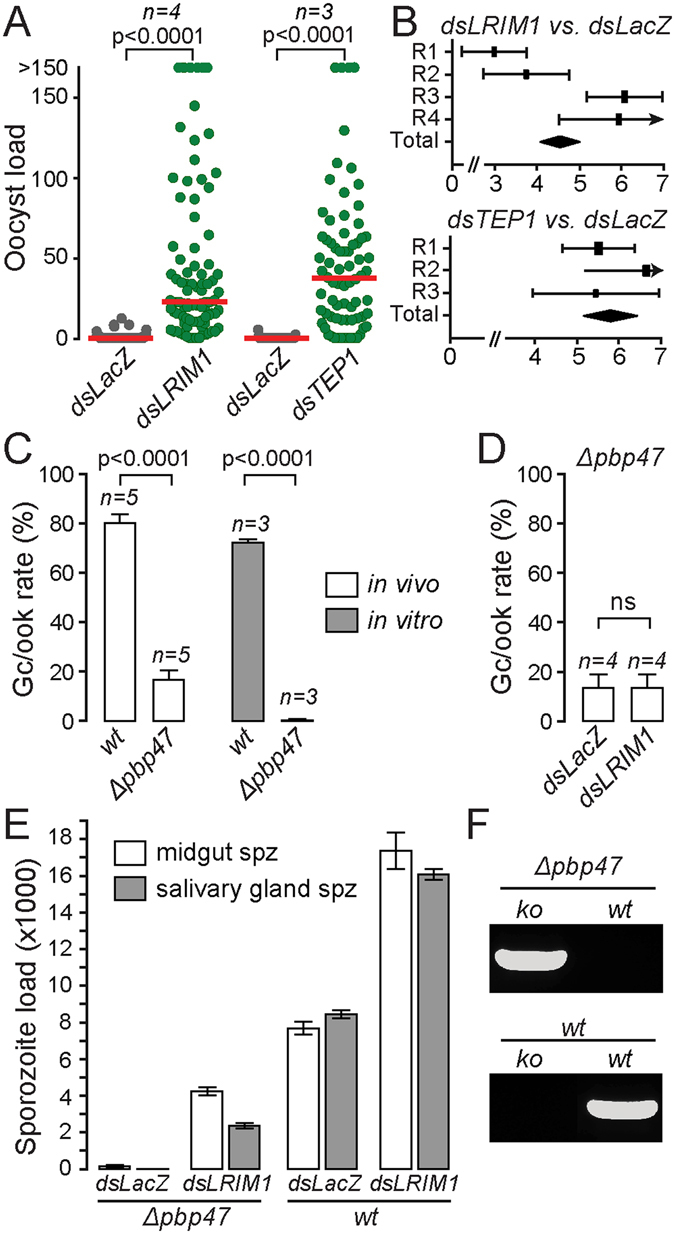
Phenotypic analysis of the Δpbp47 parasite line in A. gambiae infections. (A) Effect of dsLacZ injections (control) and LRIM1 and TEP1 silencing on Δpbp47 oocyst. The median number of oocysts is shown with a red line. Statistical significance was determined using the Mann-Whitney U-test. (B) Forest plots of GLMM analyses of the infections shown in A. The variation of the fixed effect estimate in each (squares) and all (diamonds) replicates (R) is shown ( ± 95% confidence interval, glmmADMB). The square size is proportional to the sum of midguts analyzed in each replicate. (C) In vivo and in vitro gametocyte-to-ookinete (Gc/ook) conversion rates of Δpbp47 and control ANKA 507m6cl1 (wt). (D) In vivo gametocyte-to-ookinete (Gc/ook) conversion rates of Δpbp47 parasites in dsLacZ (control) and dsLRIM1 injected mosquitoes. In both (C) and (D), the number of replicates (n) and standard deviation are shown. Statistical significance was determined with a two tailed, unpaired Student’s t-test (ns, non-significant). (E) Midgut and salivary gland Δpbp47 and ANKA 507m6cl1 (wt) sporozoite numbers in control dsLacZ and dsLRIM1 injected A. gambiae. The mean of the pooled data from two biological replicates is presented. For each replicate, sporozoite numbers were determined from 25 midguts or salivary glands at days 15 and 21 post blood feeding, respectively. Error bars show standard error. (F) PCR genotypic analysis of the Δpbp47 knockout (ko) or wt locus on blood stage parasites of the Δpbp47 and ANKA 507m6cl1 (wt) parasite lines following transmission from LRIM1 silenced A. gambiae.
