
Figure 3.
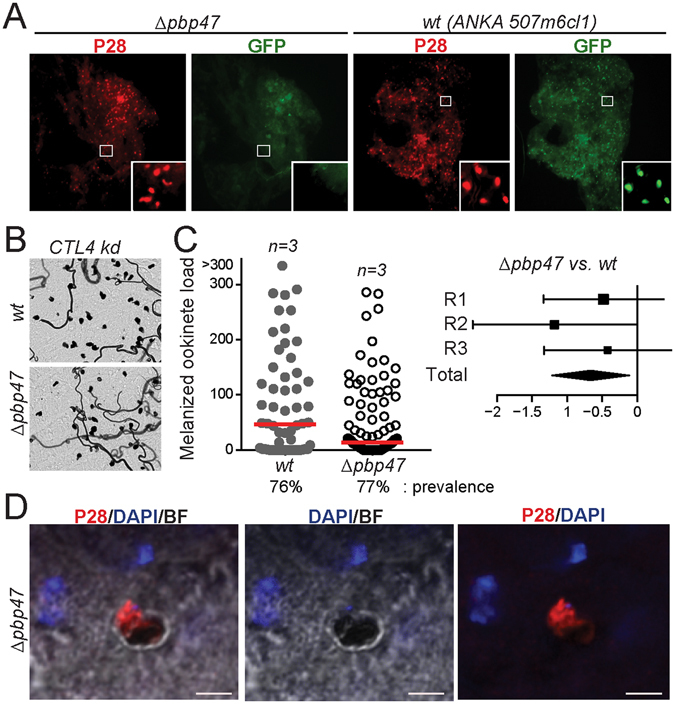
Midgut invasion assays of Δpbp47 parasites. (A) Fluorescence microscopy of ANKA 507m6cl1 (wt) and Δpbp47 ookinetes stained with P28 antibody in the A. gambiae midgut epithelium 24–26 hours post blood feeding. Images are taken at 100x magnification, and inset images at 400x magnification. (B) Light microscopy images (100x magnification) of melanized ANKA 507m6cl1 (wt) and Δpbp47 parasites in CTL4 silenced A. gambiae mosquito midguts. (C) Left: load of melanized ANKA 507m6cl1 (wt) and Δpbp47 ookinetes in the midguts of CTL4 silenced mosquitoes (left). Red lines show the median ookinete load. Right: forest plots of melanized ookinete loads as determined by GLMM analysis. The variation of the fixed effect estimate in each (squares) and all (diamonds) replicates (R) is shown ( ± 95% confidence interval, glmmADMB). The square size is proportional to the sum of midguts analyzed in each replicate. (D) Confocal images (630x magnification) of a Δpbp47 melanized ookinete in the midgut of CTL4 silenced A. gambiae, stained with the P28 antibody (red) and DAPI (blue). BF is bright field. Scale bar is 5 µm.