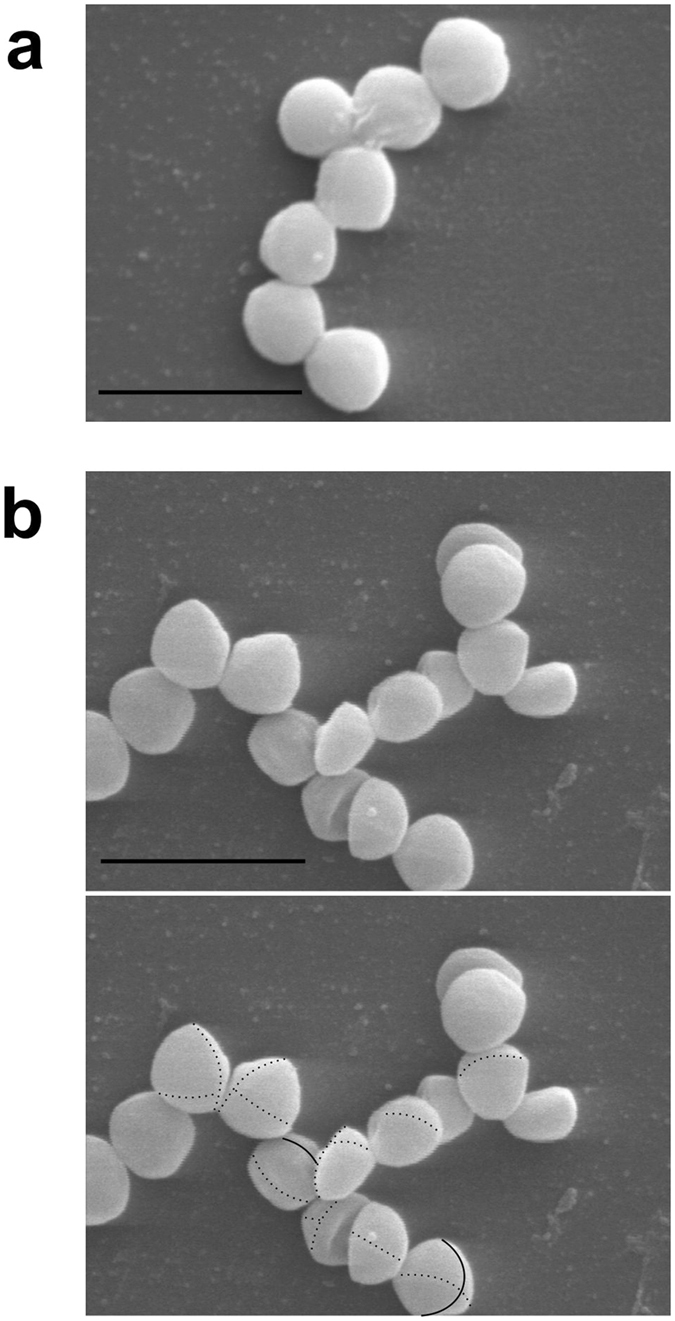
Figure 2.

Phenotype of the LytU deficient mutant. (a) Scanning electron micrograph of the wild-type S. aureus Newman control. Scale bar, 2 µm. (b) On top an image of LytU-deficient Newman strain mutant cells without markings and on the bottom the same picture with markings. Scale bar, 2 µm. Sites of active septa are marked with thin solid lines while the previous cell division line and the one before that are marked with thin dashed lines. While sites of cell division (septa) and daughter cells filling up to spheres were abundantly present in the wild type sample as well as in the mutant sample it was very hard to find any evidence on the location of the previous cell division planes in the control sample. For the mutant strain sample adjusting focus and magnification in EM made tracking of the traces of the previous cell division sites easier than what can be visualised in any still photograph. It should be noted that the position of the next cell division plane in S. aureus is independent of the previous one. Therefore, not every cell in the frame has the latest division circle, or a part of the one before, detectable on the front surface (possible area of detection being less than half of the actual full cell surface). Transmission EM study did not reveal any differences between the wild type and LytU mutant and the pictures are thus not shown.
