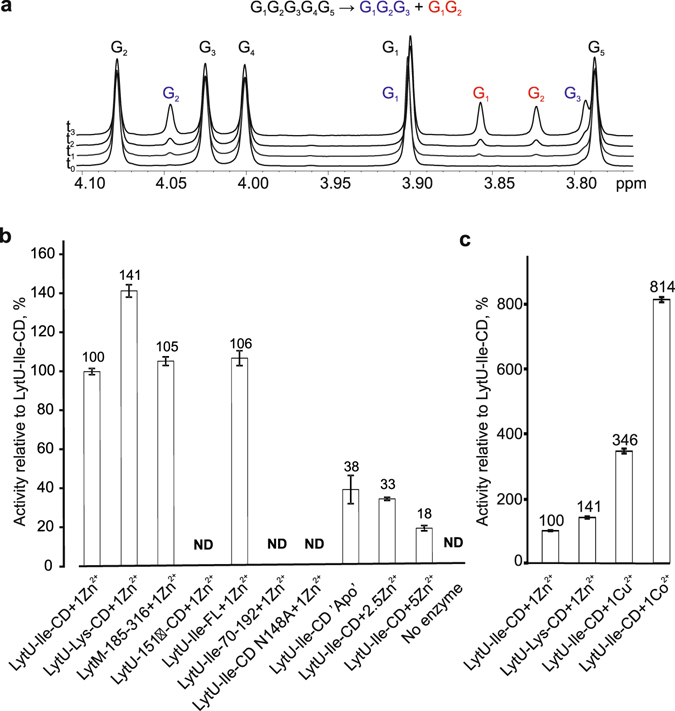
Figure 5.

Catalytic activity. (a) Representative 1H spectra of 2 mM pentaglycine in PBS buffer (pH 7.3, 90% D2O) before (t0) and during the cleavage by LytU (t1–t3). Pentaglycine is cleaved into tri- and diglycine. Substrate and product signals are labelled. Pentaglycine and product G1 signals overlap. Integration of product signals as a percent of TSP standard (not shown) allows to monitor and quantify the reaction rate. (b and c) Relative activity of proteins as a percentage of the activity of one zinc-bound catalytic domain of LytU-Ile. Reactions were linear for up to 70 hours. CD, catalytic domain, FL, full-length, ND, not detected. The bars represent standard error (SEM) of at least two independent measurements.
