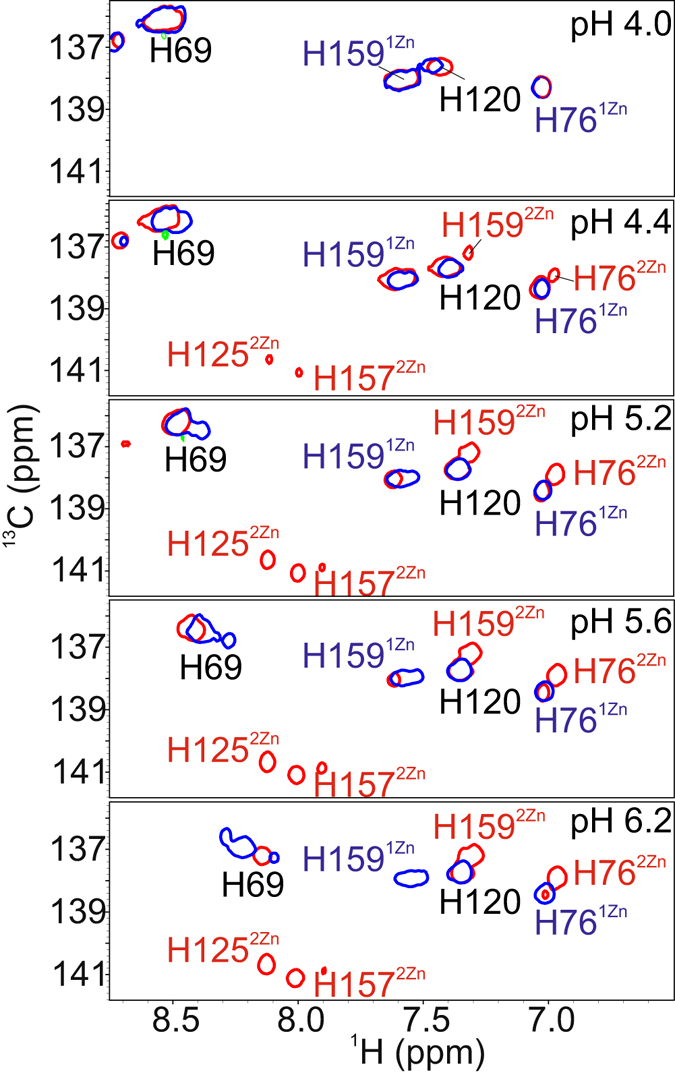
Figure 6.

pH dependence of the second zinc binding. 1H, 13C HSQC spectra encompassing the aromatic peak region were acquired for one- and two-zinc LytU with ~0.4 pH unit intervals. Only titration figures at the lower end of the range (4.0–6.2) are provided due to the lack of differences at higher pH values. Shown are the overlays of the histidine ε1 region of one- and two-zinc LytU spectra at different pHs. One-zinc LytU is represented with blue contours and two-zinc LytU with red contours. At low pH, the Cε1-Hε1 regions of the 1H, 13C HSQC spectra of one- and two-zinc LytU are identical: H76 and H159 ε1 peaks have same positions and no peaks are observed for H125 or H157. When pH is raised, H76 and H159 ε1 peaks at positions corresponding to the two-zinc form appear and gain intensity. In addition, H125 and H157 ε1 peaks emerge. At pH 5.2 the one- and two-zinc His ε1 peaks have approximately equal intensity, and at pH over 6.5 one-zinc LytU disappears from the two-zinc LytU sample.
