Figure 4.

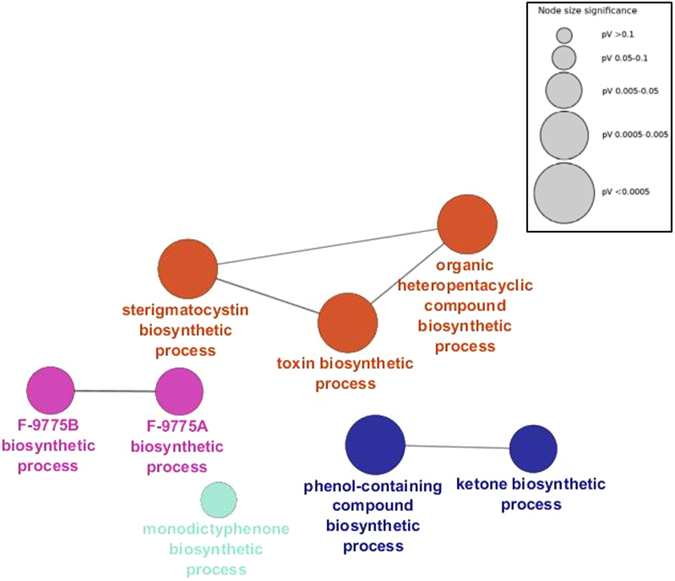
Gene Ontology Enrichment (GOE) analysis of the genes upregulated in celAΔ. Gene Ontology (GO) terms sharing similar associated genes are connected with a line. The circle sizes represent different p-values (inset).

Gene Ontology Enrichment (GOE) analysis of the genes upregulated in celAΔ. Gene Ontology (GO) terms sharing similar associated genes are connected with a line. The circle sizes represent different p-values (inset).