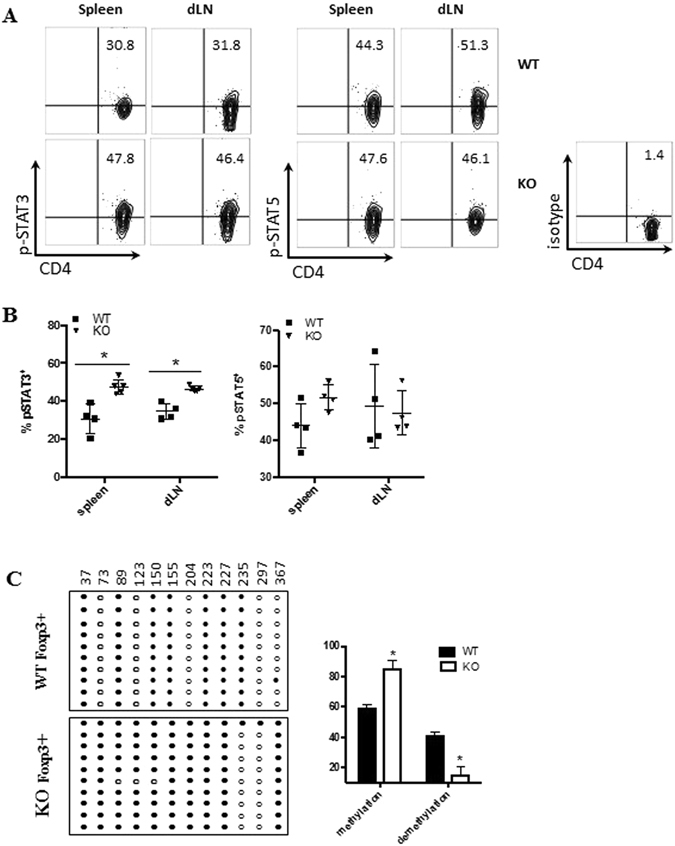
Figure 5.

PD-1H promotes the commitment of iTreg cells. (A) The transferred iTreg cells from each group (gate on CD45.2+CD4+) in the EAE model were analysed on Day 13. The spleen and dLN cells were intracellularly stained with pSTAT3 or pSTAT5 with specific mAb. (B) Same as A but phosphorylation of STAT3 and STAT5 on transferred iTreg cells is displayed as plotted value. (C) The DNA methylation status of the CNS2 region was determined by bisulfite sequencing. Each line represents one clone (one DNA strand); open cycle, un-methylated cites; filled circles, methylated cites.
